What is Random Weibull Data?
Random Weibull Data generates values from the Weibull distribution one of the most flexible and widely used distributions in reliability engineering and lifetime analysis. It is defined by a shape parameter (β, beta) and a scale parameter (θ, theta). The shape parameter determines the failure rate behaviour over time, making the Weibull distribution uniquely adaptable to different failure modes.
Simple Definitions: Generates random lifetime or time-to-failure values highly versatile for reliability simulations because the shape parameter controls whether failures are early, random, or wear-out.
| Shape (β) | Failure Pattern |
| β < 1 | Decreasing failure rate — early-life (infant mortality) failures |
| β = 1 | Constant failure rate — equivalent to exponential distribution |
| β > 1 | Increasing failure rate — wear-out failures over time |
| β ≈ 3.5 | Closely approximates a normal distribution |
When to use Random Weibull Data?
- Use to simulate product lifetimes, time-to-failure, or time-to-repair.
- Use for testing Weibull analysis and reliability tools with known parameters.
- Use when the failure rate changes over time increasing, decreasing, or constant.
Guidelines for correct usage of Random Weibull Data
- Select a shape parameter (β) that reflects the known failure behaviour of your product or process.
- All generated values are positive.
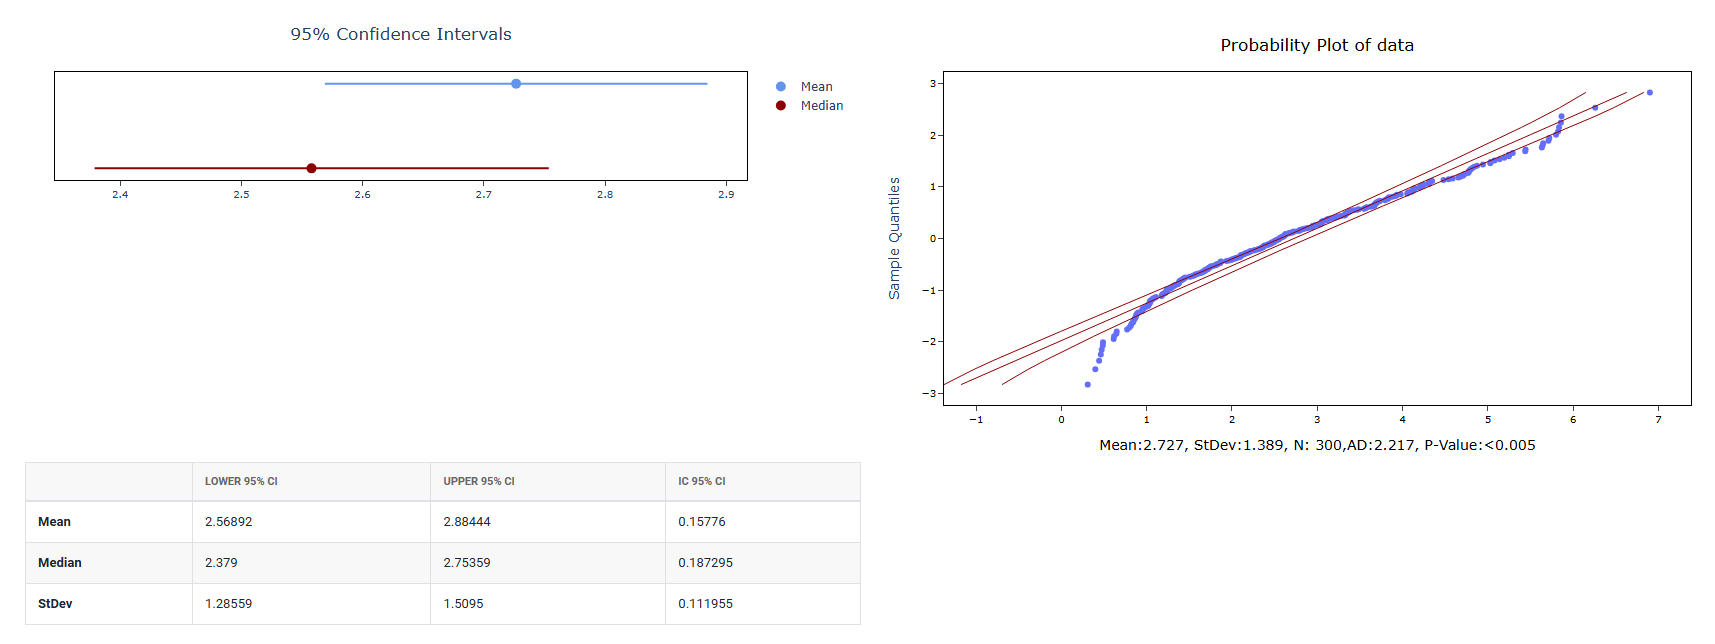
- Verify the output using Weibull probability plots to confirm the distribution fits as expected.
Alternatives: When not to use Random Weibull Data
- If the failure rate is constant, use Random Exponential Data it is a simpler special case.
- For symmetric continuous measurements, use Random Normal Data
Example of Random Weibull Data
The following steps to Generate Random Weibull Data:
- To Generate Random Weibull Data need to fill the required options.
- Now analyses the data with the help of https://qtools.zometric.com/ or https://intelliqs.zometric.com/.
- To find Random Weibull Data choose https://intelliqs.zometric.com/> Statistical module> Random Data > Random Weibull Data
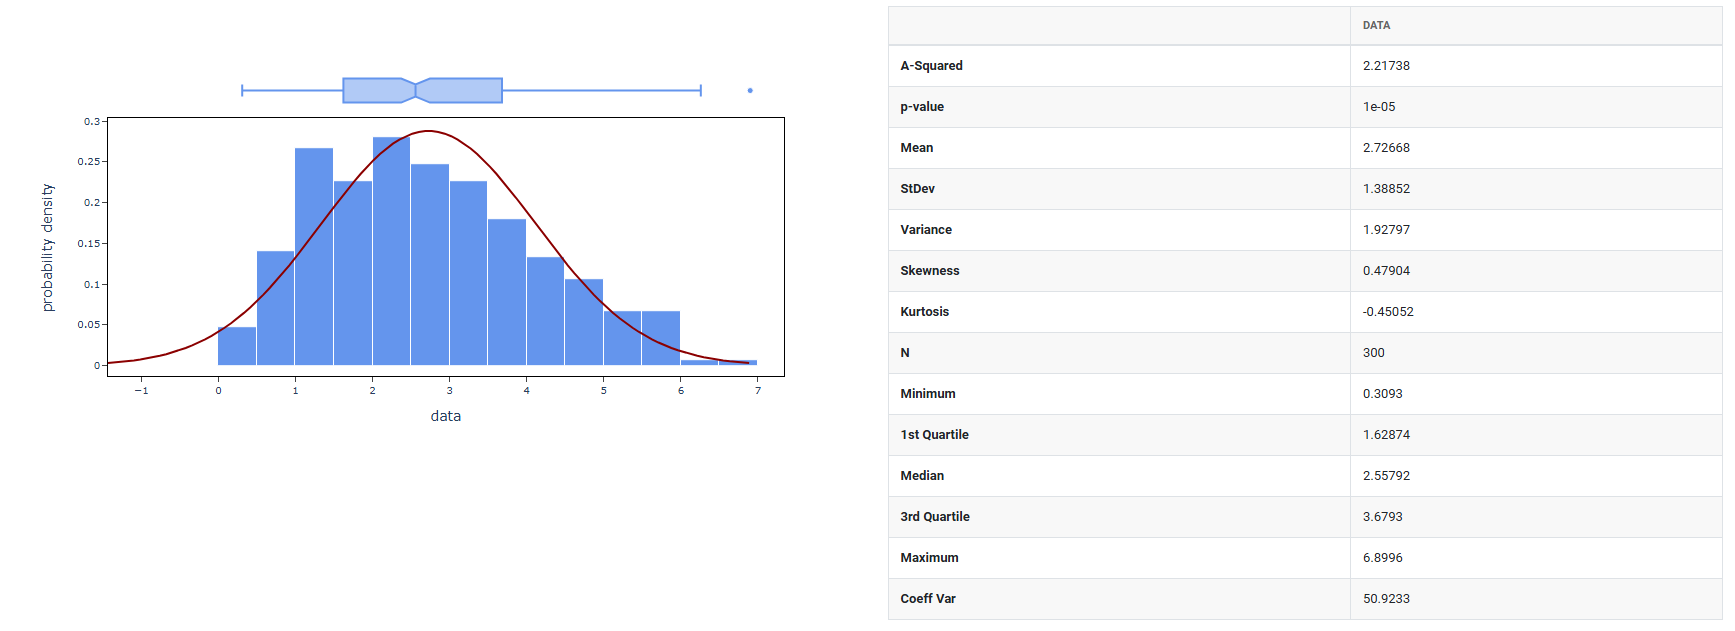
4. After using the above mentioned tool, fetches the output as follows:
How to do Random Weibull Data
The guide is as follows:
- Login in to QTools account with the help of https://qtools.zometric.com/ or https://intelliqs.zometric.com/
- On the home page, choose Statistical Tool> Random Data>Random Weibull Data.
- Next, you need to fill the required options.
- Finally, click on calculate at the bottom of the page and you will get desired results.
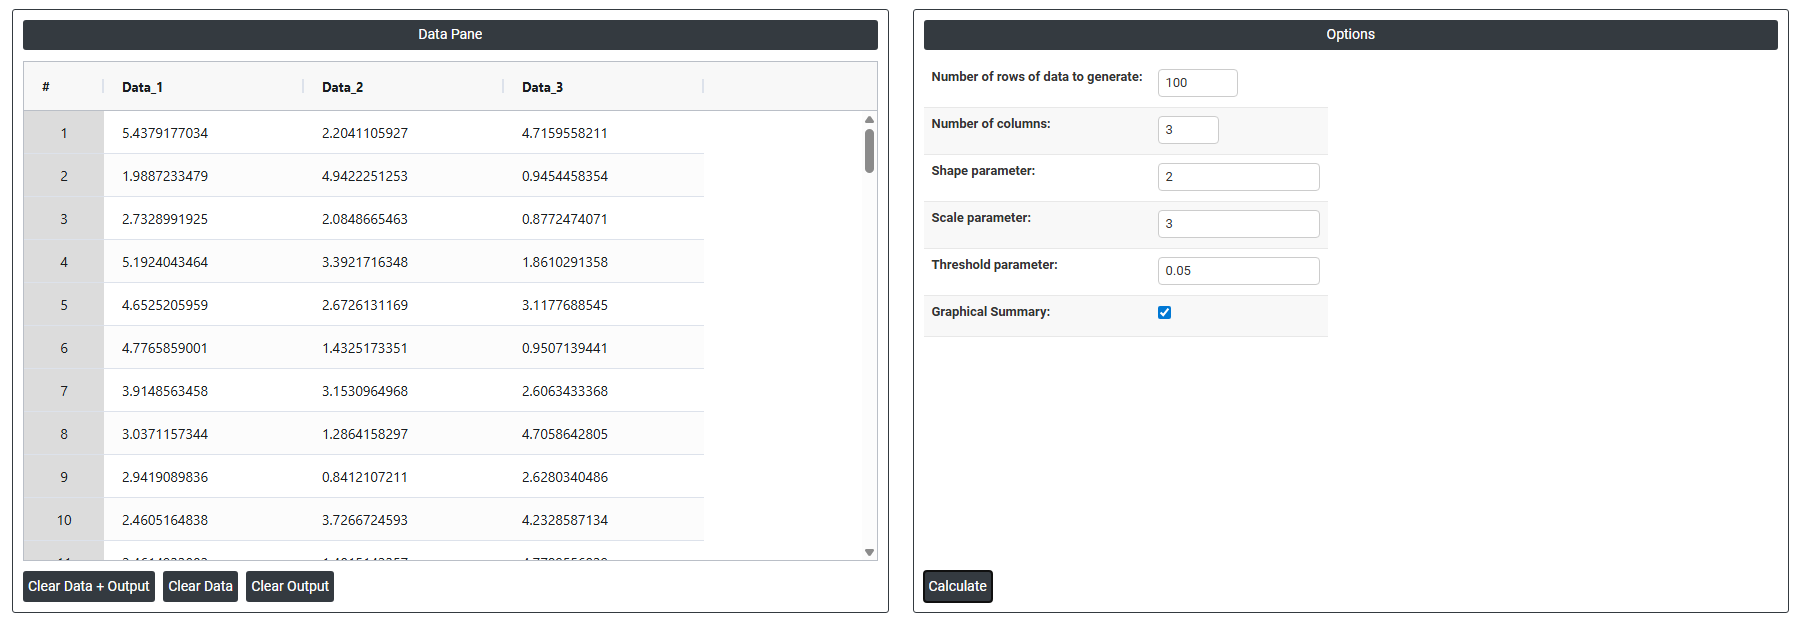
On the dashboard of Random Weibull Data, the window is separated into two parts.
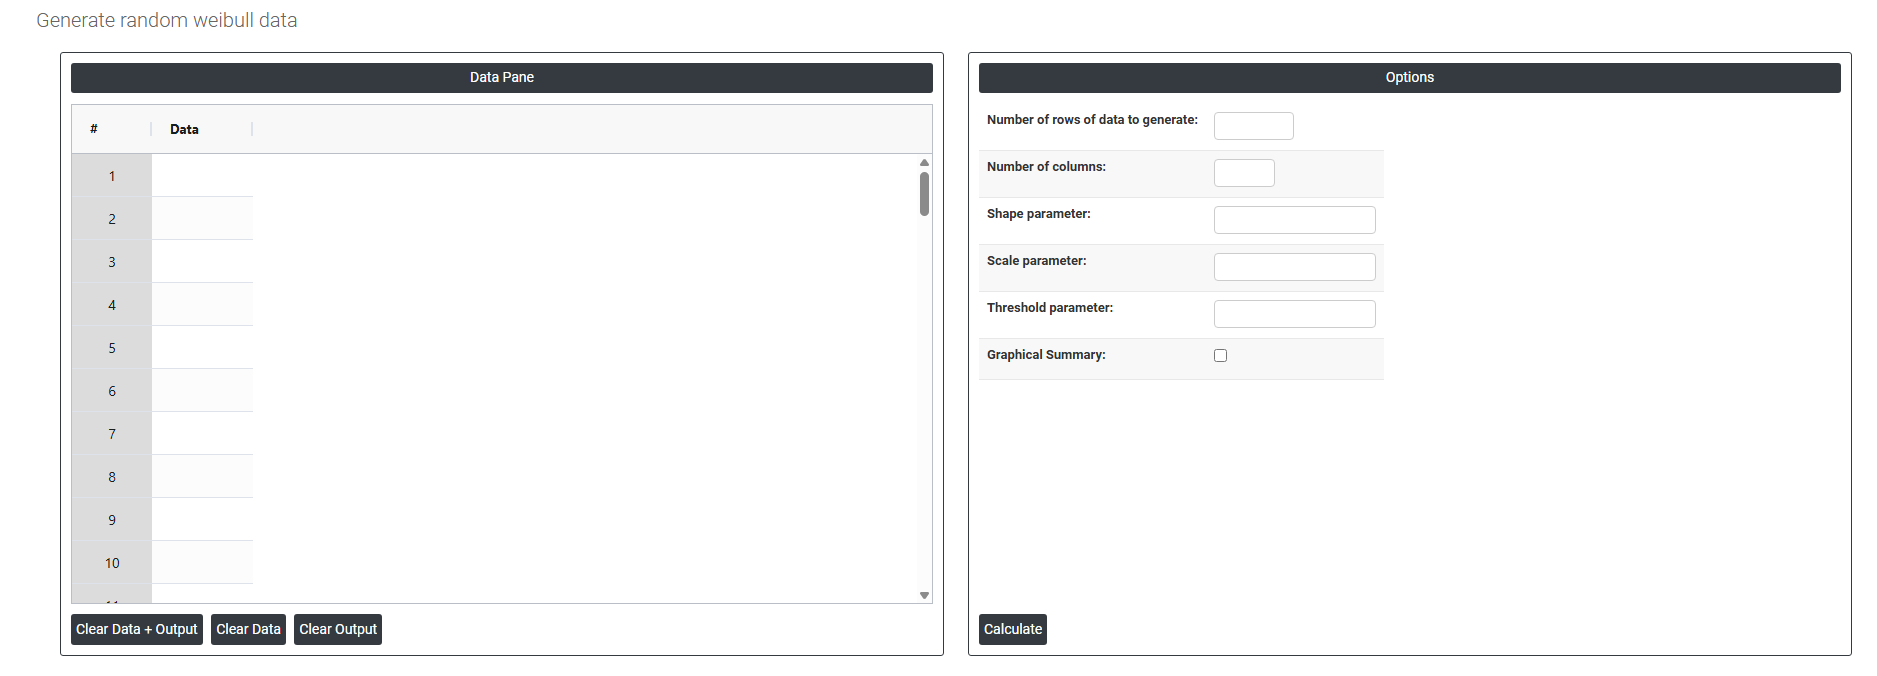
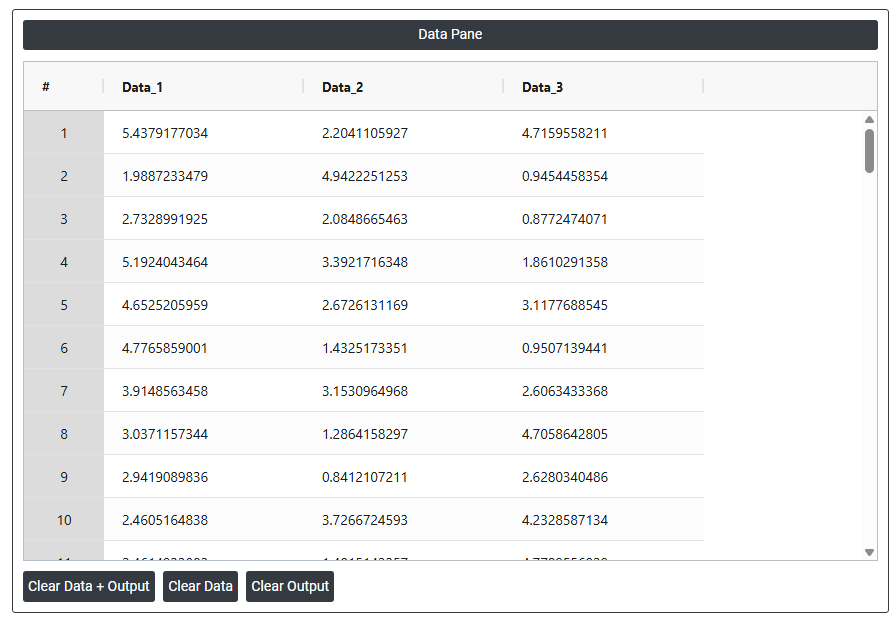
On the left part, Data Pane is present. In the Data Pane, each row makes random data generated. Data will be generated after filling the required options.
On the right part, there are many options present as follows:
- Number of rows of data to generate: Specifies how many random data points to generate. For example, entering 10 will produce exactly 10 rows of random values, all visible in the data pane.
- Number of columns: Specifies how many variables (columns) each row will have. For example, entering 3 will produce 3 columns of randomly generated data side by side in the data pane.
- Shape parameter: Controls the shape of the Weibull distribution. It determines how the failure or event rate behaves over time. A value less than 1 means the rate decreases over time, exactly 1 produces a constant rate (equivalent to an exponential distribution), and greater than 1 means the rate increases over time. The generated random data will reflect whichever pattern this value defines.
- Scale parameter: controls the spread or scale of the generated data, essentially stretching or compressing the distribution along the horizontal axis. A larger value spreads the data out and shifts the bulk of values higher; a smaller value compresses them closer to zero. All randomly generated values are scaled according to this parameter.
- Threshold parameter: sets the minimum starting point of the distribution. By default it is 0, meaning data can start from zero. If you enter a positive value, all generated random values will be shifted up by that amount so no generated value will fall below the threshold. It effectively moves the entire distribution to the right along the number line.
- Graphical summary: After the random data is generated using the mean and standard deviation you specified, this option produces a graphical analysis of that data such as a histogram showing how the generated values are distributed. It is a visual result based on the data that was just created.