What is Response optimizer?
Response Optimizer uses the fitted DoE model to automatically identify the factor settings that produce the most desirable outcomes for one or more responses simultaneously. It uses a mathematical desirability function to balance competing objectives and find the single best operating condition.
Simple Definitions: An automated tool that finds the best combination of input settings to hit your target outcomes whether maximising, minimising, or aiming for a specific value across one or several responses at the same time.
When to use Response optimizer ?
- Use after fitting a DoE model (Factorial, DSD, or RSM) to find the factor settings that achieve the best response values.
- Use when you have multiple responses with competing or conflicting goals that must all be satisfied simultaneously.
- Use to explore trade-offs between responses and find the best overall compromise.
Guidelines for correct usage of Response optimizer
- Set realistic goals for each response targets outside the experimentally explored range cannot be reliably predicted.
- Assign importance weights to each response if some outcomes are more critical than others.
- Review the overall desirability value close to 1.0 means all goals are well met; low values suggest irreconcilable conflicts between responses.
- Always verify the optimum with confirmation runs before implementing process changes.
Alternatives: When not to use Response optimizer
- If no DoE model has been fitted, run and analyse a DoE first Response Optimizer requires a fitted model to work.
- If only one simple response needs optimising, reviewing the main effects plot may be sufficient without formal optimisation.
Example of Response optimizer
The following steps:
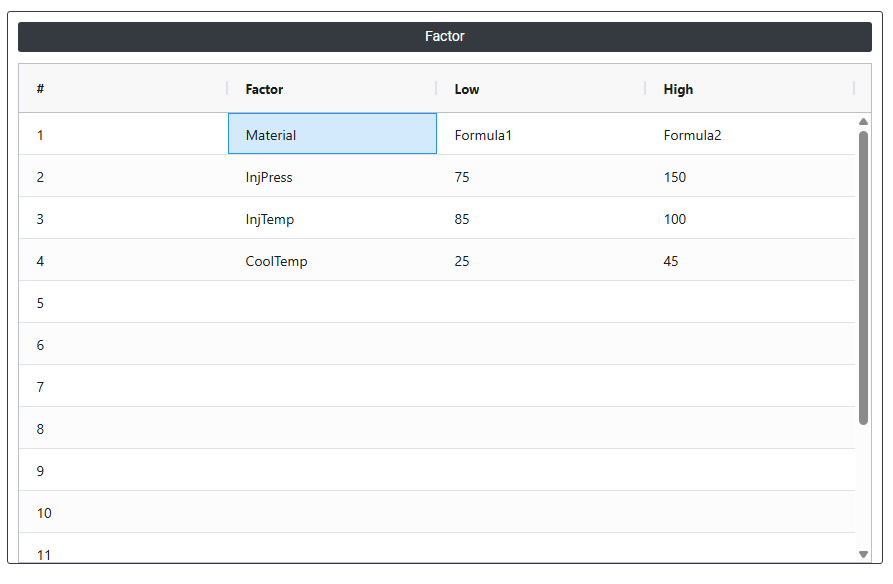
- Input the necessary data on right side panel Factor.
2. Now analyses the data with the help of https://qtools.zometric.com/ or https://intelliqs.zometric.com/.
3. To find Response optimizer choose https://intelliqs.zometric.com/> Statistical module> DOE>Response optimizer.
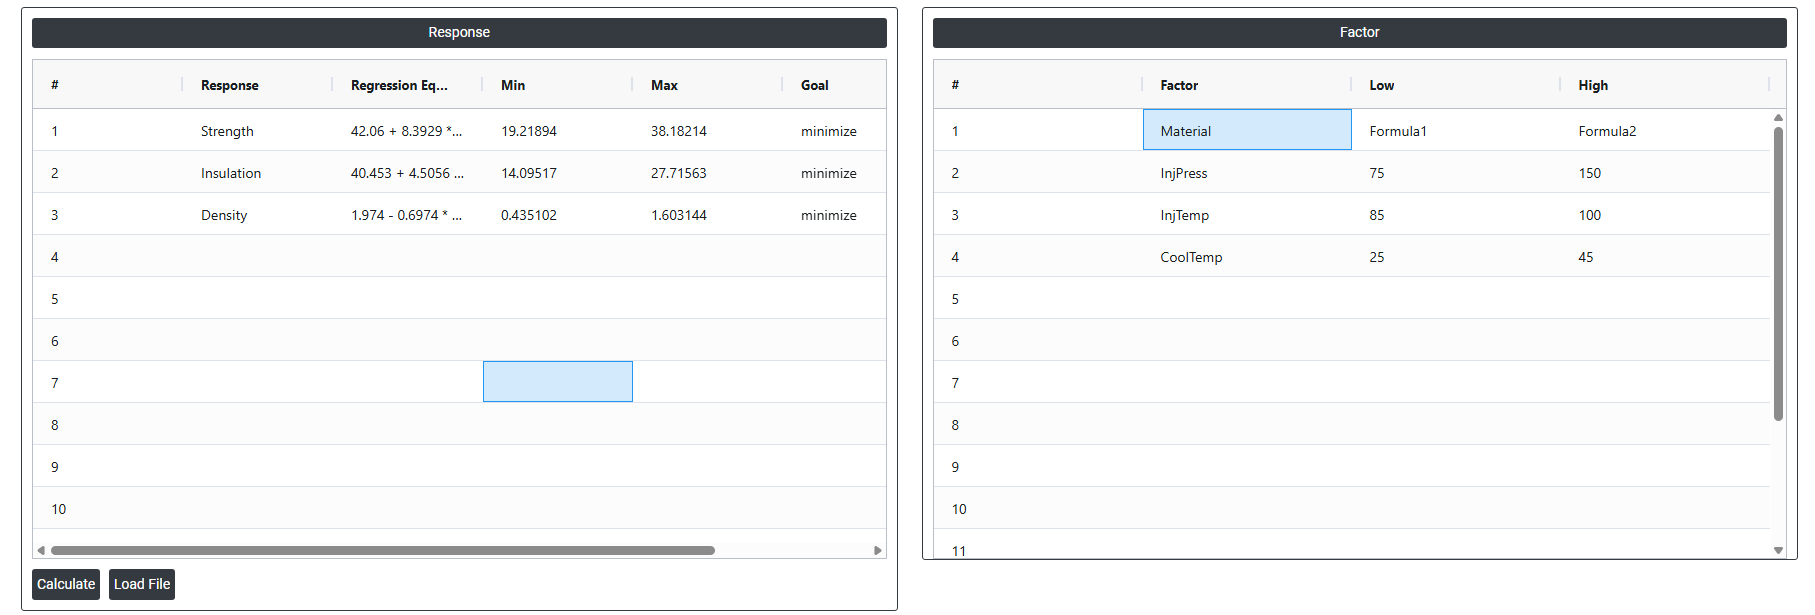
4. Inside the tool, feed the data on the left side panel Response or using load file as follows:
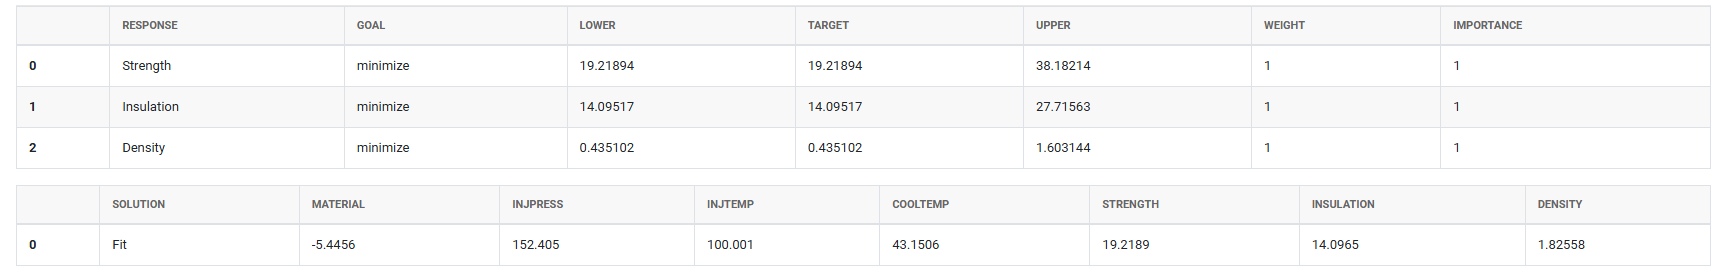
5. After using the above mentioned tool, fetches the output as follows:
How to do Response optimizer
The guide is as follows:
- Login in to QTools account with the help of https://qtools.zometric.com/ or https://intelliqs.zometric.com/
- On the home page, choose Statistical Tool> DOE>Response optimizer.
- Next, update the data manually or can completely copy (Ctrl+C) the data from excel sheet or paste (Ctrl+V) it or else there is say option Load Example where the example data will be loaded.
- Next, you need to fill the required options.
- Finally, click on calculate at the bottom of the page and you will get desired results.
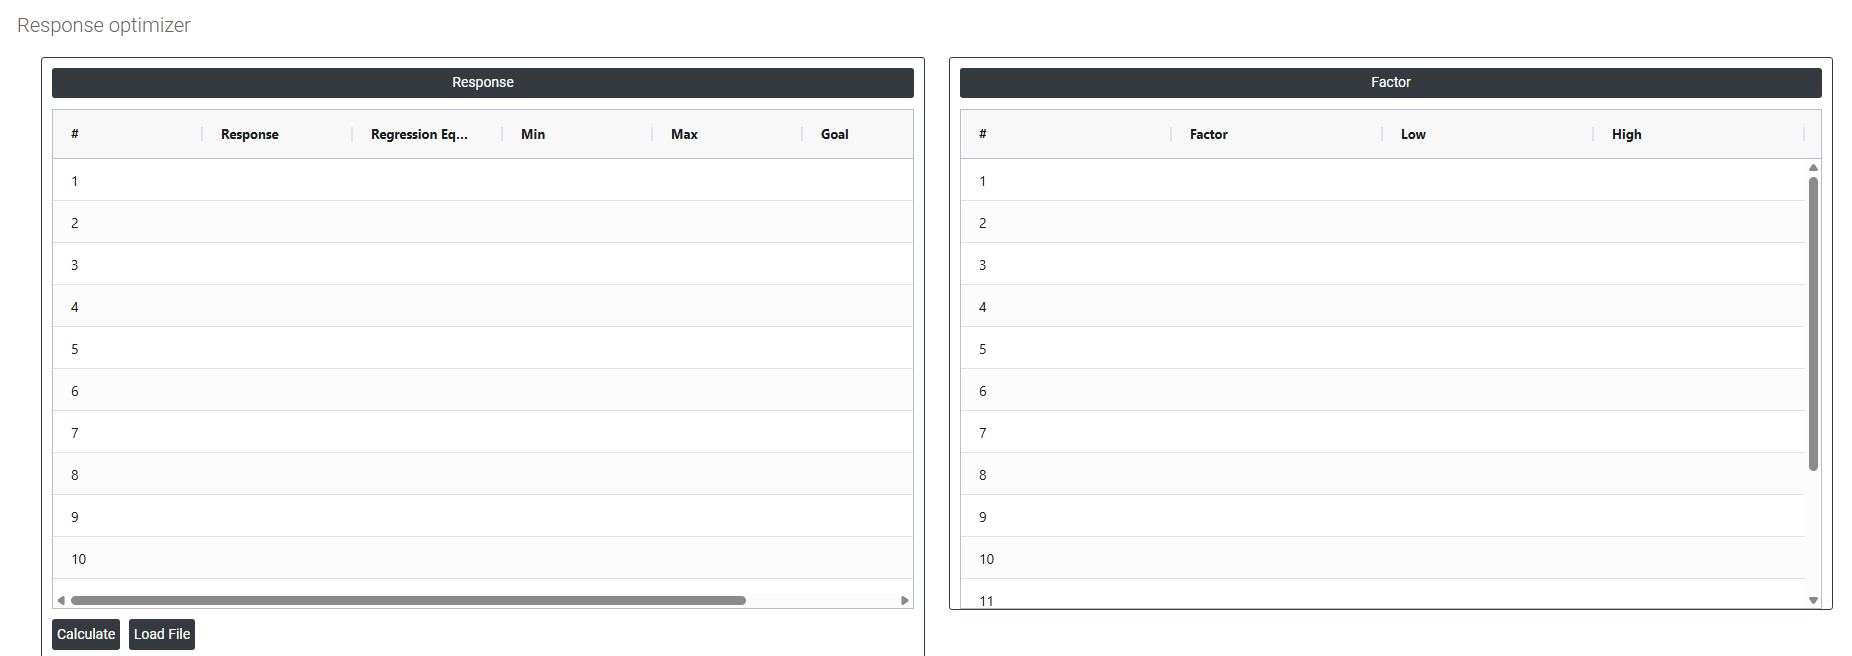
On the dashboard of Response optimizer, the window is separated into two parts.
On the right part, Factor is present. In the Factor , need to input the data. Data can be fed manually or the one can completely copy (Ctrl+C) the data from excel sheet and paste (Ctrl+V) it here.
Load example: Sample data will be loaded.
Load File: It is used to directly load the excel data.
On the left part, there are many options present as follows:
- Response: The output variable from your fitted DoE model that you want to optimise such as yield, strength, or defect rate. If multiple responses were measured in the experiment, each one appears as a separate row in the optimizer, allowing all of them to be optimised simultaneously using a single set of factor settings.
- Regression Equation: Add the fitted mathematical equation that describes the relationship between the predictors and this specific response. This equation was generated during the DoE analysis and is what the optimizer uses internally to calculate the predicted response value at any given combination of factor settings. It serves as a reference so you can see exactly which terms and coefficients are driving the optimisation.
- Min: The minimum acceptable value for this response. Any predicted response value below this threshold is considered completely undesirable and receives a desirability score of zero. Setting a realistic minimum prevents the optimizer from recommending factor settings that technically optimise one goal but produce an unacceptable outcome on another dimension.
- Max: The maximum acceptable value for this response. Any predicted response value above this threshold is also considered completely undesirable and receives a desirability score of zero. Together, Min and Max define the acceptable boundaries within which the response must fall for the solution to be considered valid.
- Goal: Defines what you want the optimizer to do with this response. The goal directly controls how the desirability function is shaped for this output:
- Maximise — the optimizer pushes the response as high as possible toward or beyond the target, up to the maximum. Use when higher is always better such as yield, strength, or efficiency.
- Minimise — the optimizer pushes the response as low as possible toward or below the target, down to the minimum. Use when lower is always better such as defect rate, cost, or cycle time.
- Target — the optimizer aims to hit a specific value as precisely as possible. Desirability is highest at the target and decreases on both sides. Use when there is an ideal value such as a nominal dimension or a specific pH level.
- Target: The ideal or desired value for this response used when the Goal is set to Target. The optimizer assigns maximum desirability when the predicted response equals this value exactly, and decreasing desirability as the response moves away from it in either direction. Even when the Goal is set to Maximise or Minimise, entering a target value helps guide the optimizer by defining the point at which desirability reaches its maximum within the acceptable range.