What is Run Test?
The Runs Test assesses whether a sequence of data values is arranged in a truly random order. A run is a consecutive series of values all above or all below the median. The test counts the total number of runs and compares this count to the expected number if the sequence were random. Too few runs suggests clustering or trending; too many suggests an unusual alternating pattern.
Simple Definitions: A test that checks whether your data is arranged in a genuinely random sequence, or whether a hidden pattern such as a trend, cycle, or clustering is distorting the order.
When to use Run Test?
- Use to verify the randomness assumption before running analyses that require independent, randomly ordered data.
- Use when you suspect trends, cycles, or systematic patterns in the data sequence.
- Use on residuals from regression or control charts to confirm errors are randomly distributed.
- Use on individual continuous or binary data collected in a meaningful time or sequence order.
Guidelines for correct usage of Run Test
- Data must be kept in the exact order it was collected rearranging data destroys the sequence information the test depends on.
- Very small samples (fewer than 10) may not provide enough runs for reliable non-randomness detection.
- A non-significant result means no evidence of non-randomness was detected, not that the data is guaranteed random.
- Use alongside control charts or time-series plots to visually confirm any patterns suggested by the test result.
Alternatives: When not to use Run Test
- If testing for a specific trend direction, use regression analysis or trend test
- If data is autocorrelated, use autocorrelation analysis
- If checking randomness in control chart residuals, use the built-in Western Electric or Nelson detection rules
Example of Run Test
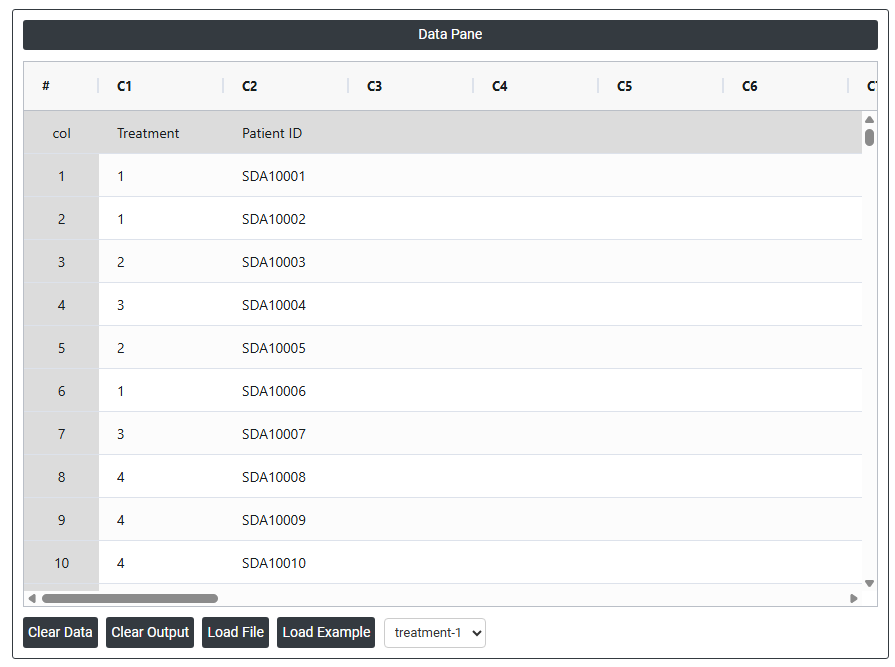
A researcher for a pharmaceutical company wants to determine whether the assignments of treatments to patients are random. Thirty-five patients were selected, and each patient was assigned to one of three treatments. The researcher wants to test whether the treatment assignments occurred in a random order. The following steps:
- Gathered the necessary data.
- Now analyses the data with the help of https://qtools.zometric.com/ or https://intelliqs.zometric.com/.
- To find Run Test choose https://intelliqs.zometric.com/> Statistical module> Nonparametric > Run Test.
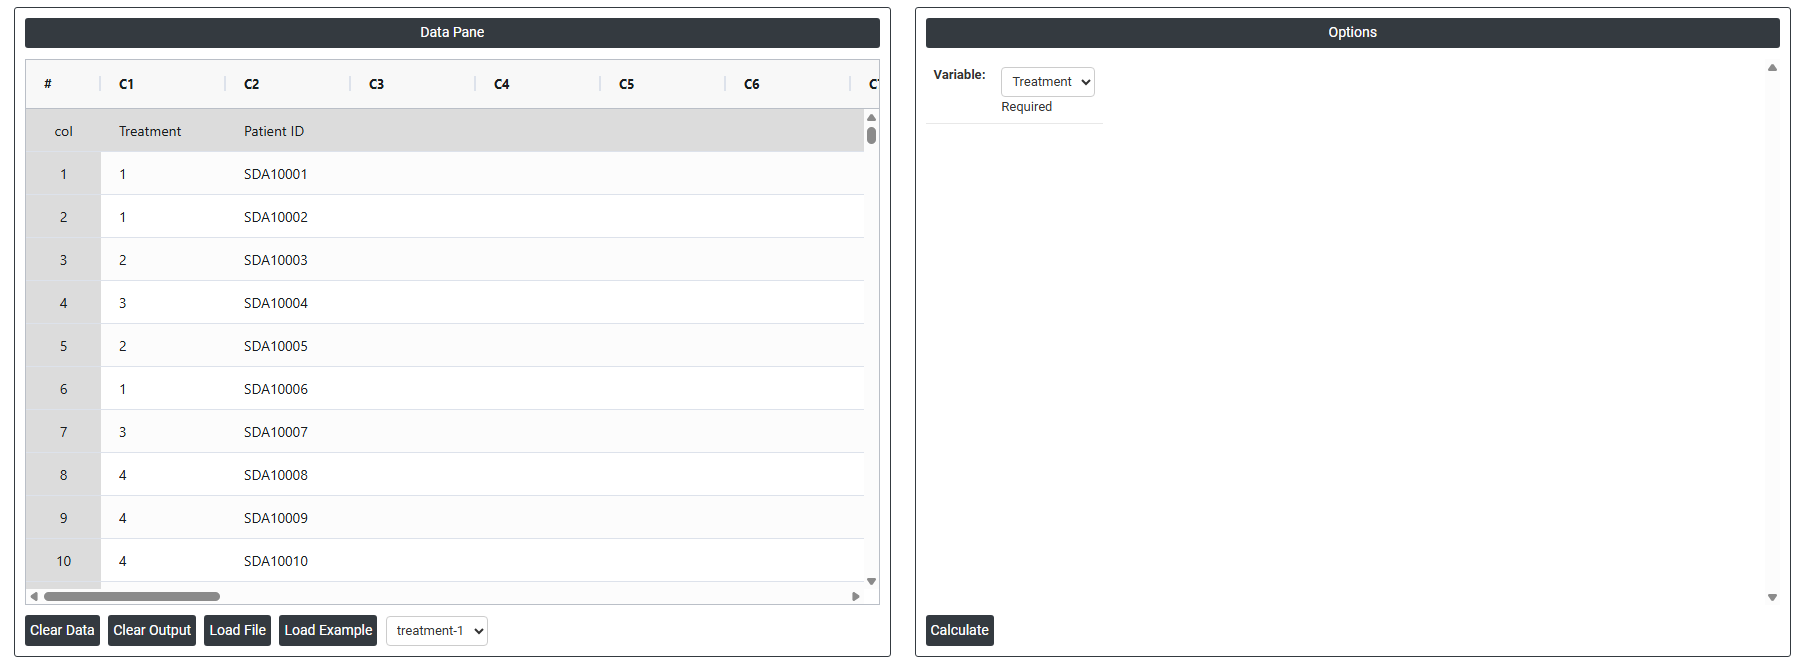
- Inside the tool, feeds the data along with other inputs as follows:
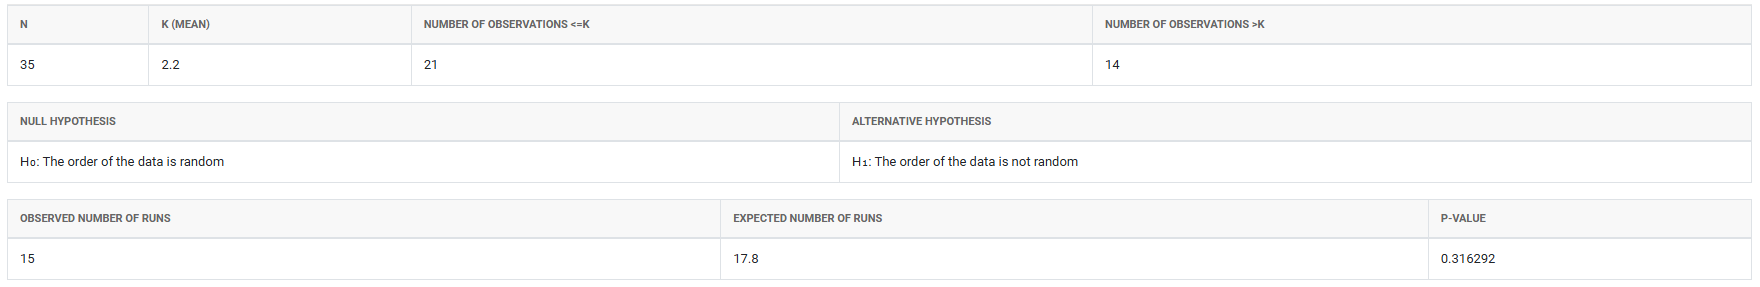
5. After using the above mentioned tool, fetches the output as follows:
How to do Run Test
The guide is as follows:
- Login in to QTools account with the help of https://qtools.zometric.com/ or https://intelliqs.zometric.com/
- On the home page, choose Statistical Tool> Nonparametric>Run Test.
- Next, update the data manually or can completely copy (Ctrl+C) the data from excel sheet and paste (Ctrl+V) it here.
- Next, you need to fill the required options.
- Finally, click on calculate at the bottom of the page and you will get desired results.
On the dashboard of Run Test, the window is separated into two parts.
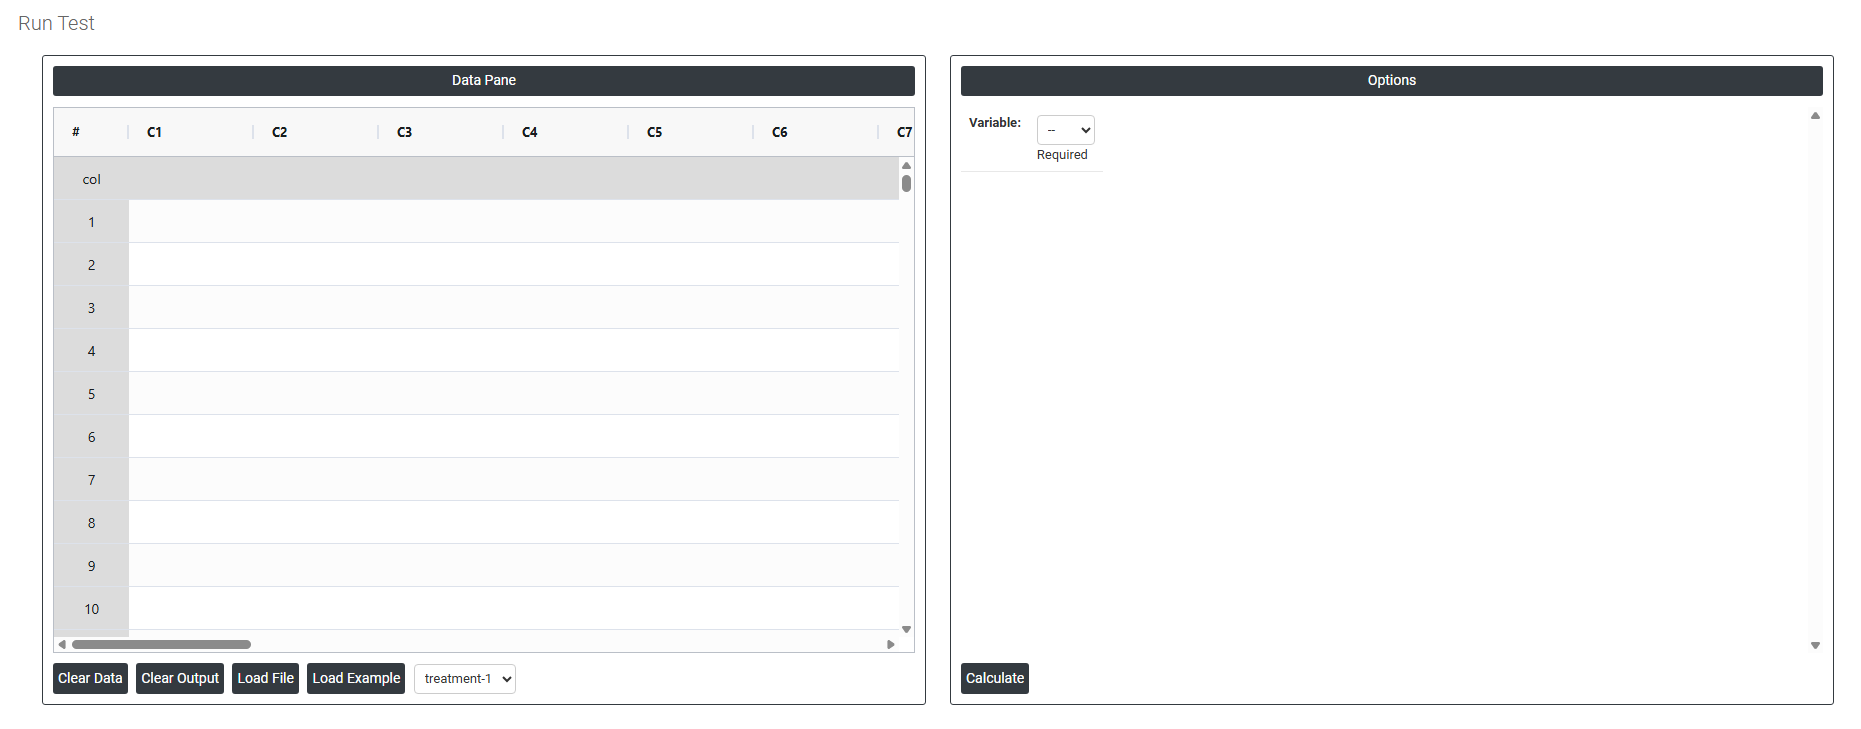
On the left part, Data Pane is present. In the Data Pane, each row makes one subgroup. Data can be fed manually or the one can completely copy (Ctrl+C) the data from excel sheet and paste (Ctrl+V) it here.
Load example: Sample data will be loaded.
Load File: It is used to directly load the excel data.
On the right part, there are many options present as follows:
-
Variable: Select the column that contains the data you want to test for randomness. This must be a continuous or numeric column recorded in the exact order the measurements were collected. The sequence order is critical the test analyses whether the pattern of values above and below the median is random, so the data must remain in its original collection order.