What is Stability Study?
A Stability Study is a statistical analysis used to determine how long a product remains within its defined quality specifications over time. It models the relationship between time and a measurable response variable to estimate the product's shelf life the point at which the response is expected to go beyond acceptable limits.
In Zometric, the Stability Study tool fits a regression model to time-based data, with the option to include a batch factor, and calculates when the product is predicted to fall outside its specification limits.
When to use Stability Study?
Data Requirements
• The dataset must include a time variable as the primary predictor this is what drives the analysis.
• An optional batch factor can be included to account for differences across production batches; this factor can be treated as fixed or random depending on the study design.
• The response variable must be continuous ,for example, potency, concentration, pH, or weight.
Data Collection Guidelines
• Ensure the data accurately represents the population or product of interest incomplete or biased data leads to unreliable shelf life estimates.
• Collect sufficient data points across multiple time intervals to provide the precision needed for accurate predictions.
• Measure all variables as accurately and precisely as possible measurement errors directly affect the quality of the model.
• Record data in the order it is collected to preserve the time-based structure of the analysis.
Model Fit
• The model must provide a good fit to the data a poorly fitting model will produce misleading shelf life estimates.
• After fitting, review residual plots, diagnostic statistics for unusual observations, and model summary statistics to confirm the model accurately represents the data.
Guidelines for correct usage of Stability Study
• Use a continuous response variable such as potency, concentration, or moisture content; categorical responses are not suitable for this analysis.
• Always include a time variable as the predictor the entire analysis is built around tracking change over time.
• Include a batch factor when multiple production batches are being studied to capture batch-to-batch variability in the shelf life estimate.
• Decide whether to treat the batch factor as fixed (specific batches of interest) or random (batches representative of a larger population) based on the study objective.
• Collect data that truly represents the target population or product data from non-representative conditions will yield inaccurate shelf life predictions.
• Gather enough data points across sufficient time intervals to support statistically reliable estimates and reduce prediction uncertainty.
• Measure all variables with maximum precision even small measurement errors can shift the estimated shelf life significantly.
• Record observations in the order they are collected to maintain the integrity of the time-series structure.
• After fitting the model, always validate it using residual plots and model summary statistics before drawing any conclusions or reporting shelf life.
• A poor model fit is a signal to reconsider the model structure, check for outliers, or re-examine the data before proceeding.
Alternatives: When not to use Stability Study
• If there is no time variable in the data, use Fit Regression Model instead to analyze the relationship between other continuous predictors and the response.
• If the goal is to predict a response from multiple non-time predictors, use Fit Regression Model for multi-variable analysis.
• If the response variable has two categories such as pass or fail, use Fit Binary Logistic Model instead.
• If the response variable contains three or more ordered categories such as low, medium, or high, use Ordinal Logistic Regression instead.
• If the response variable contains three or more unordered categories such as scratch, dent, or tear, use Nominal Logistic Regression instead.
Example of Stability Study?
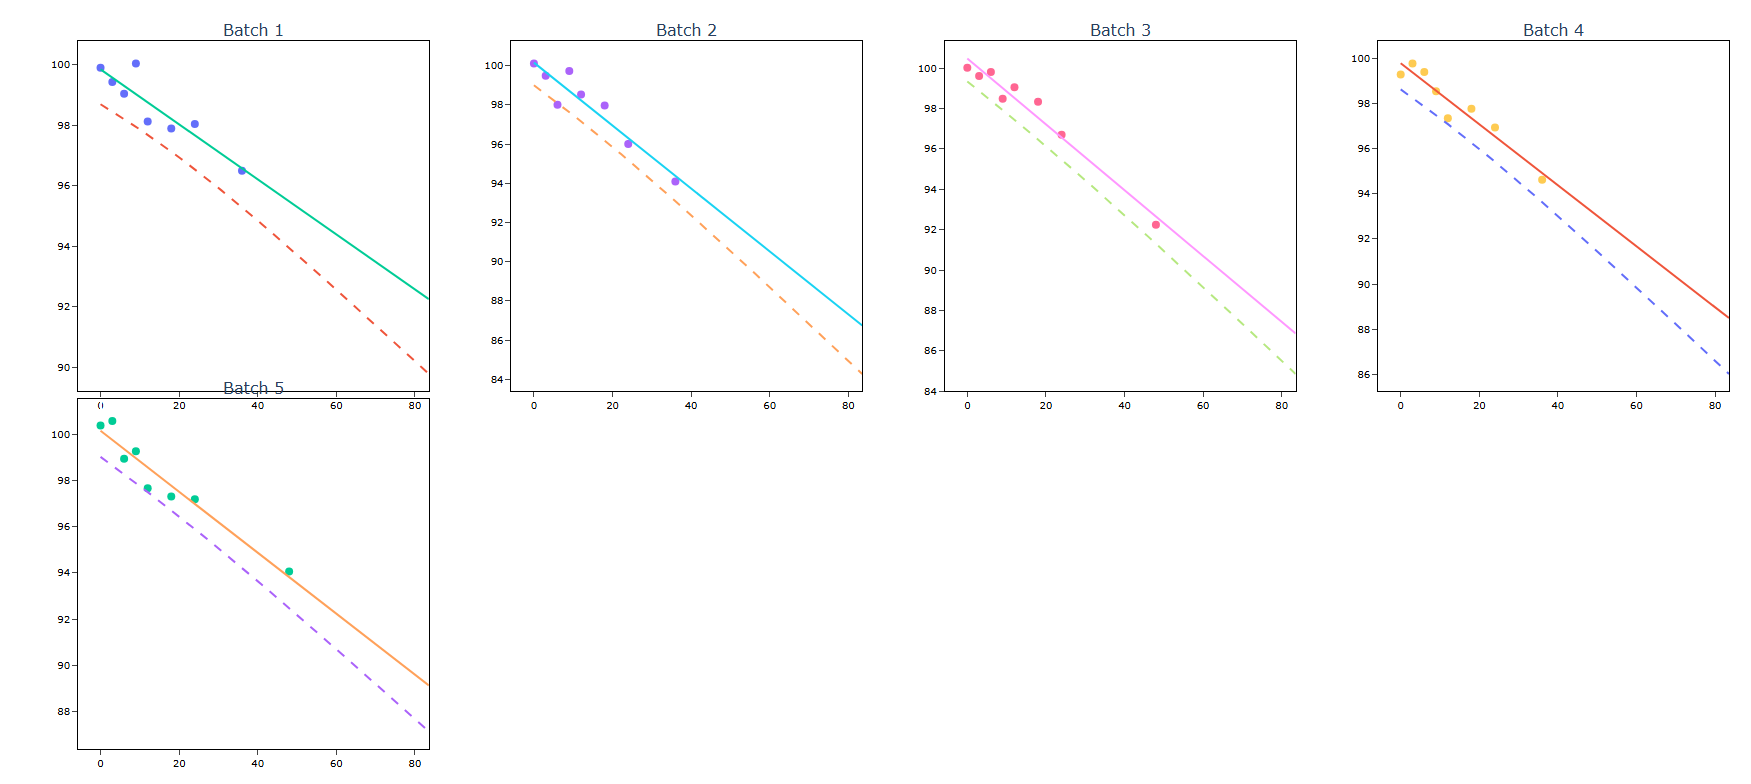
A pharmaceutical company's quality engineer aims to ascertain the duration pills containing a novel drug can remain effective. The drug's concentration within the pills diminishes gradually over time, prompting the engineer to identify the point at which it reaches 90% of its initial potency. Given the novelty of the drug, the company possesses only five pilot batches for estimating shelf life. Consequently, the engineer conducts tests on one pill from each batch at nine distinct intervals. Employing a stability study to gauge shelf life, the engineer treats each batch as a fixed factor, as all batches are systematically sampled. Enter 90 in LSL. The following steps:
- Gathered the necessary data.
- Now analyses the data with the help of https://qtools.zometric.com/ or https://intelliqs.zometric.com/.
- To find stability study choose https://intelliqs.zometric.com/> Statistical module> Regression>Stability Study.
- Inside the tool, feed the data along with other inputs as follows:
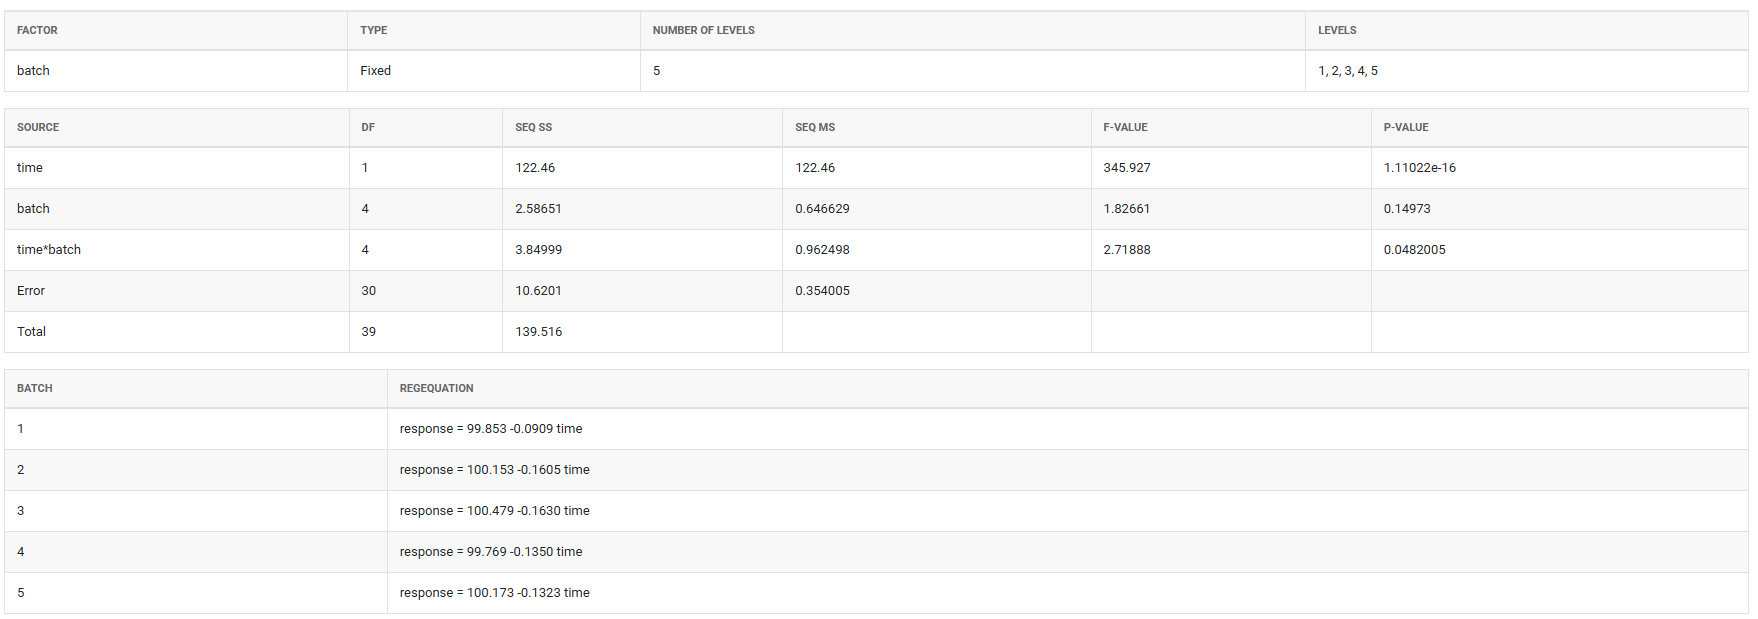
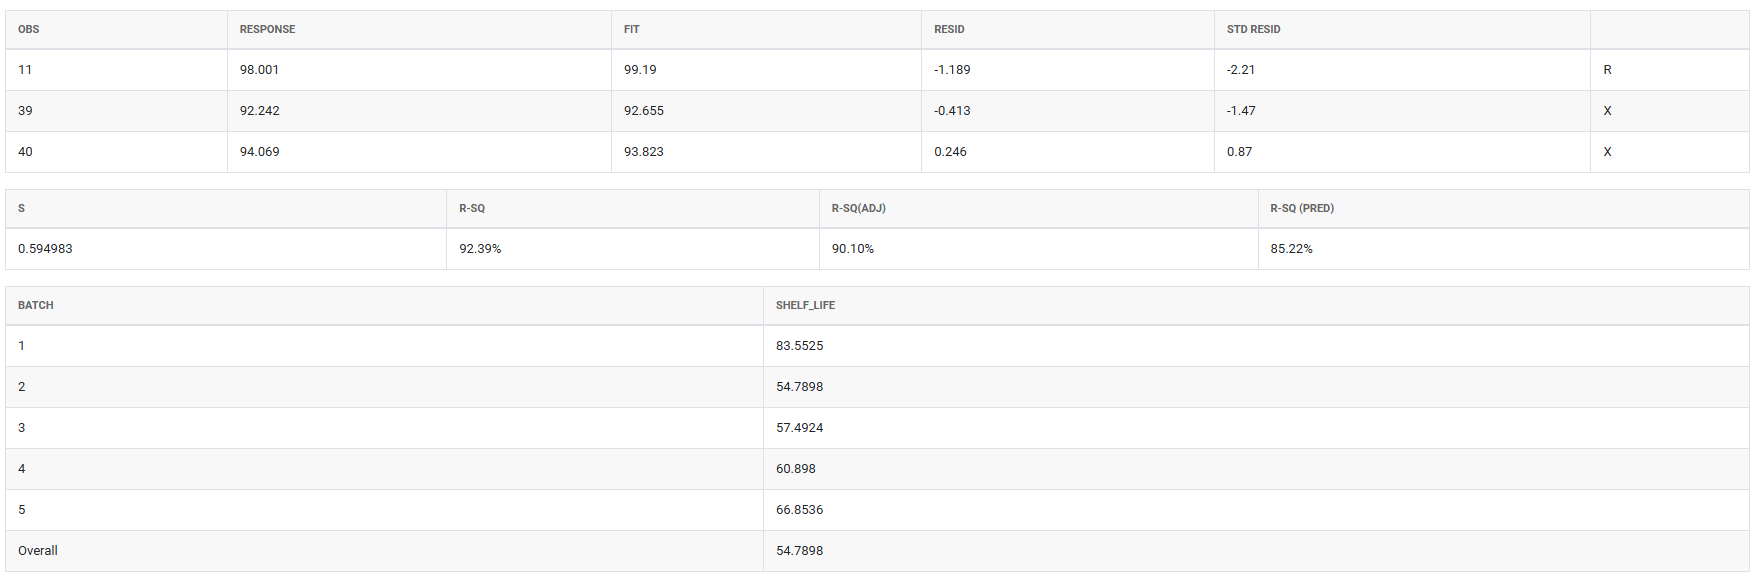
5.After using the above mentioned tool, fetches the output as follows
How to do Stability Study
The guide is as follows:
- Login in to QTools account with the help of https://qtools.zometric.com/ or https://intelliqs.zometric.com/
- On the home page, choose Statistical Tool> Regression > Stability Study.
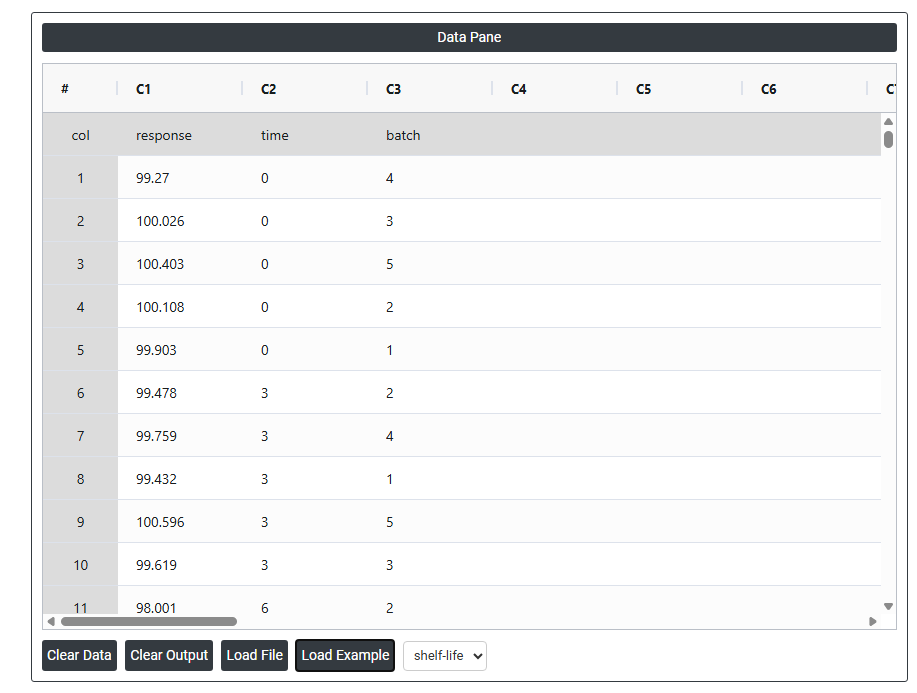
- Next, update the data manually or can completely copy (Ctrl+C) the data from excel sheet or paste (Ctrl+V) it or else there is say option Load Example where the example data will be loaded.
- Next, you need to fill the required options .
- Finally, click on calculate at the bottom of the page and you will get desired results.
On the dashboard of Stability Study, the window is separated into two parts.
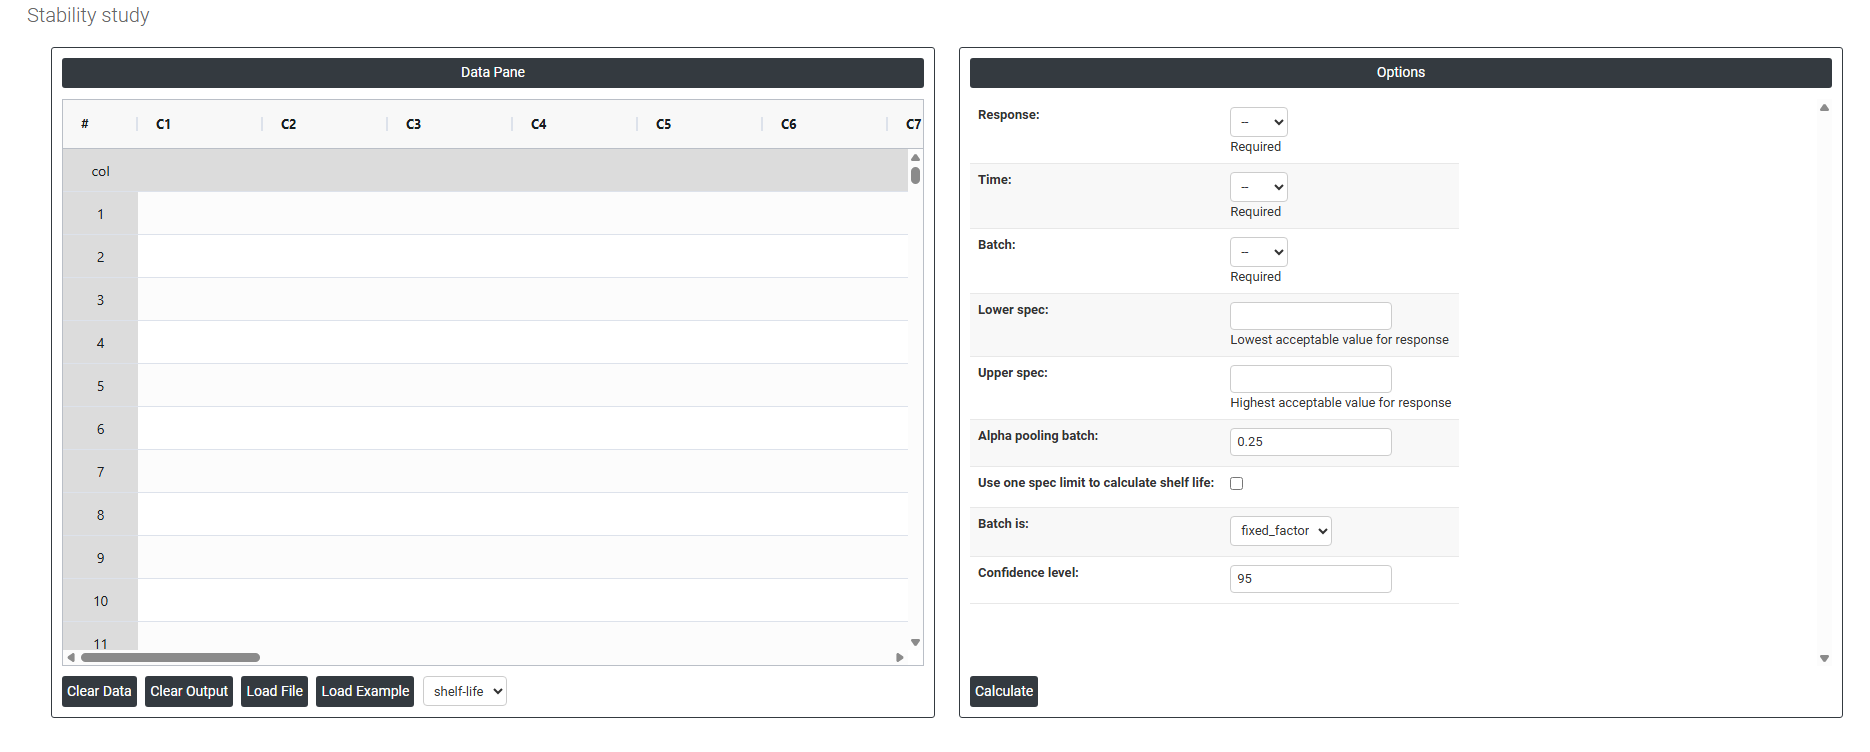
On the left part, Data Pane is present. In the Data Pane, each row makes one subgroup. Data can be fed manually or the one can completely copy (Ctrl+C) the data from excel sheet and paste (Ctrl+V) it here.
Load example: Sample data will be loaded.
Load File: It is used to directly load the excel data.
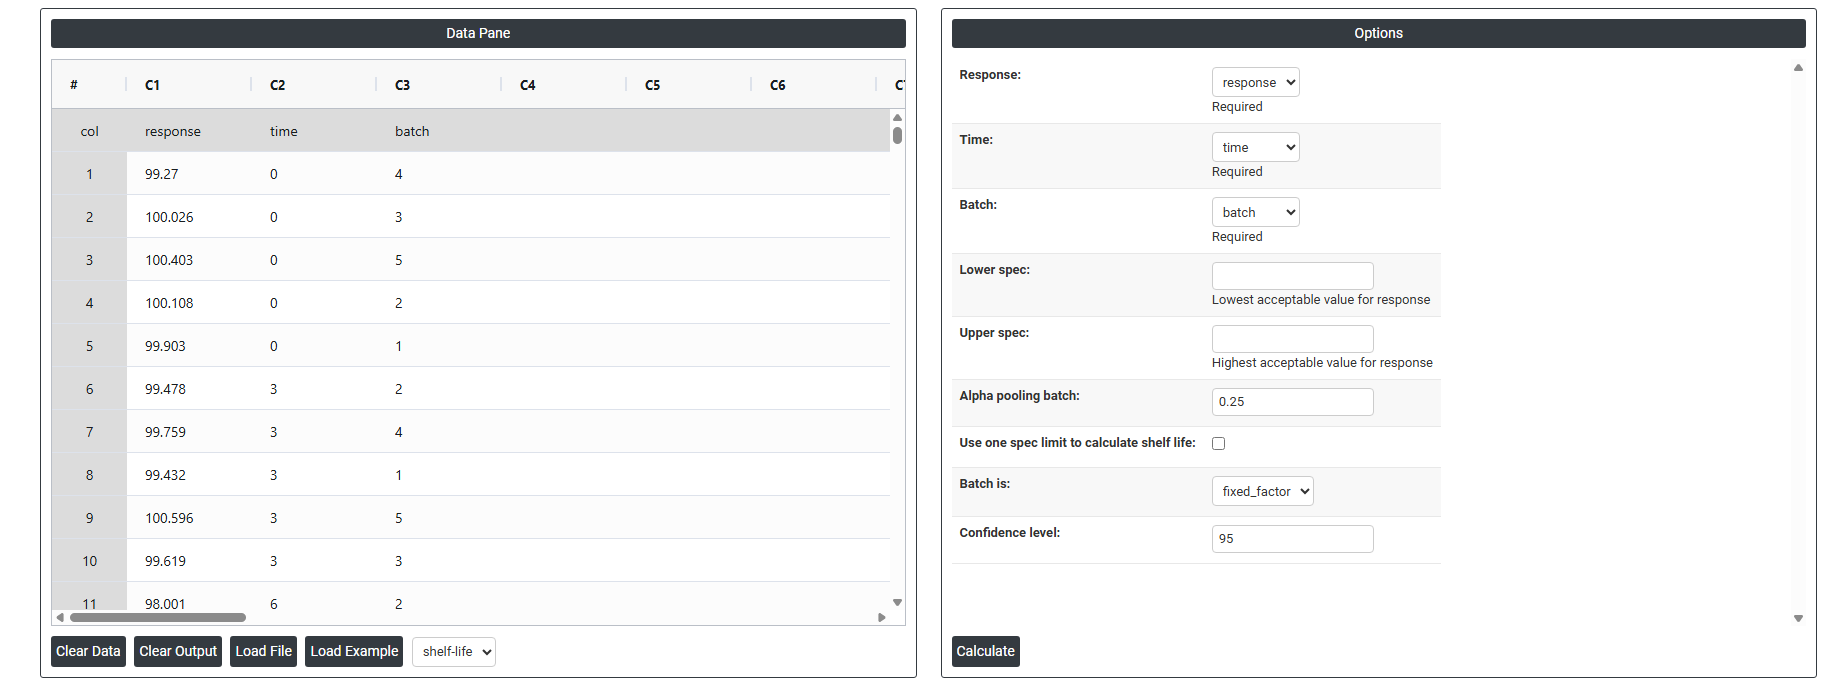
On the right part, there are many options present as follows:
- Response: The measurement you are tracking over time such as potency, pH, or moisture content. This is the variable being tested to see whether the product remains within acceptable limits throughout its shelf life.
- Time: The time points at which each measurement was recorded (e.g. 0, 3, 6, 12 months). It uses this variable to model how the response changes over the storage period.
- Batch: The specific production batch each sample belongs to. Including batch allows to detect whether different batches degrade at different rates, which directly affects the shelf life estimate.
- Lower Spec: The minimum acceptable value for the response. If the product's measurement falls below this limit, it is considered out of specification and no longer safe or effective for use.
- Upper Spec: The maximum acceptable value for the response. If the measurement exceeds this limit, the product is again considered out of specification. Depending on the product, you may use one or both spec limits.
- Alpha for Pooling Batches : Controls whether batches are analyzed separately or combined (pooled) into one model. A higher alpha value (0.25) makes it easier to pool batches, which gives a more conservative and reliable shelf life estimate. The default of 0.25 is intentionally higher than the typical 0.05 used in hypothesis testing because in stability studies, it is safer to keep batches separate unless there is strong evidence they behave the same way.
- Use One Spec Limit to Calculate Shelf Life: Some products degrade in only one direction for example, potency only decreases over time. In such cases, only one spec limit (lower or upper) is relevant. Enabling this option tells to calculate shelf life based on that single boundary rather than both, giving a more accurate and appropriate estimate.
- Batch is : Defines how the batch variable is treated statistically. When set as a Fixed Factor, the results apply only to the specific batches tested — the shelf life is estimated based on those exact batches. If set as random, results are generalized to all possible future batches. Fixed is used when those specific batches represent the product.
- Confidence Interval : A confidence interval gives a range within which the true shelf life is likely to fall. The default of 95% means you are 95% confident the actual shelf life lies within the calculated range. It is set at 95% by default because it is the widely accepted industry and regulatory standard it balances being cautious enough to protect consumers while still being practical for manufacturers. A lower value (e.g. 90%) would give a wider shelf life but less certainty; a higher value (e.g. 99%) would shorten the estimated shelf life unnecessarily.