What is Test for Equal Variances?
Test for Equal Variances is a statistical hypothesis test used to determine whether two or more groups have the same amount of variability in their data. Rather than comparing group averages, this test focuses on spread — checking whether the variation (standard deviation or variance) is statistically consistent across all groups being compared.
This is a critical prerequisite for many analyses. Several statistical tools — such as ANOVA, two-sample t-tests, and regression — assume that all groups have equal variance. Using those tools without first confirming equal variance can lead to incorrect conclusions.
Simple Definitions: A test that checks whether different groups have the same amount of spread or variability in their data a required check before running many other statistical analyses.
When to use Test for Equal Variances?
- Use before running ANOVA or t-tests to verify that the equal variance assumption is satisfied.
- Use when comparing two or more groups or process conditions and you want to know if they differ in variability, not just average.
- Use in process improvement studies to check whether a change in method, machine, or material has affected process consistency.
- Use when assessing measurement systems to determine if different operators, instruments, or labs produce data with similar spread.
Key Tests Available
The tool offers multiple tests suited to different data types and assumptions:
| Test | Best Used When |
| Bartlett's Test | Data is normally distributed — most powerful under normality |
| Levene's Test | Data may not be normal — more robust to non-normality |
| F-Test | Comparing exactly two groups with normal data |
Guidelines for correct usage of Test for Equal Variances
- Ensure data is continuous — this test is not appropriate for attribute or count data.
- Check for normality first — if data is normal, use Bartlett's test; if non-normal, use Levene's or Bonett's test.
- Collect a sufficient sample size per group (at least 20 observations per group recommended) for reliable variance estimates.
- Interpret the p-value — a p-value below your significance level (typically 0.05) indicates that at least one group has significantly different variance.
- Investigate the source of unequal variance before proceeding — do not simply ignore a significant result.
Alternatives: When not to use Test for Equal Variances
- If your data is attribute-based (pass/fail, categories), this test does not apply — use chi-square tests or proportion tests instead.
- If you are comparing means rather than variances, use ANOVA or t-tests
- If sample sizes are very small (fewer than 5 per group), variance estimates are unreliable collect more data before testing.
Example of Test for Equal Variances
A chemical engineer wants to compare the hardness of four blends of paint. Six samples of each paint blend were applied to a piece of metal, which was then cured. Then each sample was measured for hardness. The following steps:
- Gathered the necessary data.
- Now analyses the data with the help of https://qtools.zometric.com/ or https://intelliqs.zometric.com/.
- To find Test for Equal Variances choose https://intelliqs.zometric.com/> Statistical module> Anova>Test for Equal Variances.
- Inside the tool, feeds the data along with other inputs as follows:
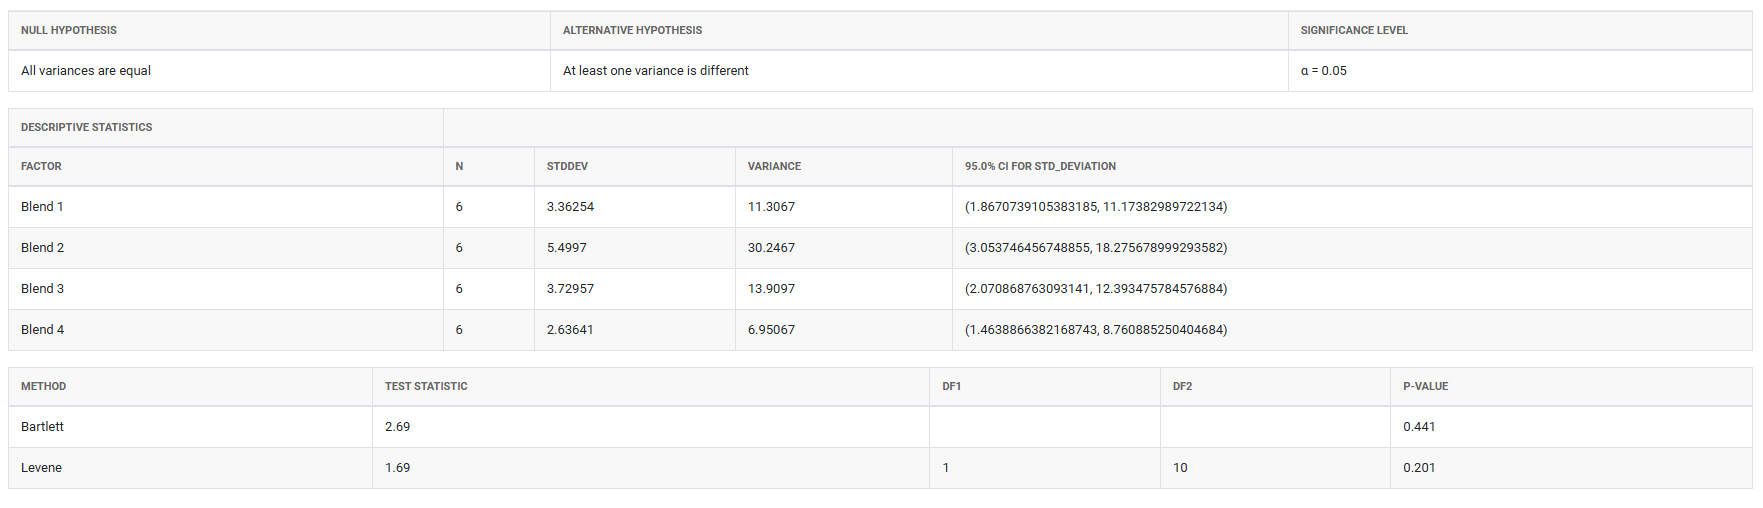
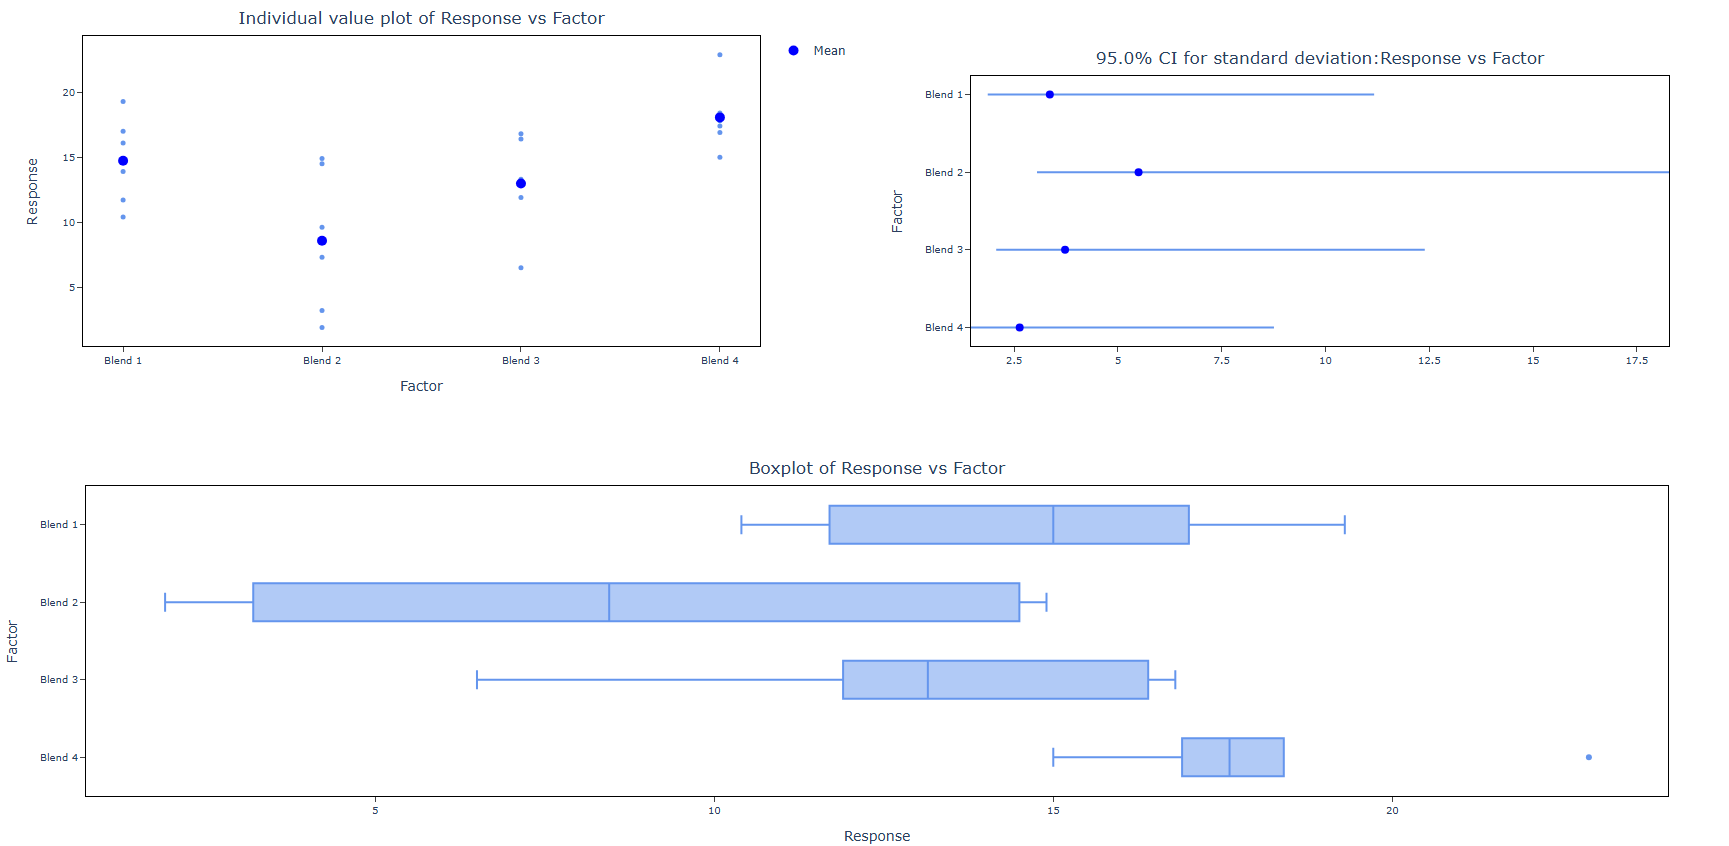
5. After using the above mentioned tool, fetches the output as follows:
How to do Test for Equal Variances
The guide is as follows:
- Login in to QTools account with the help of https://qtools.zometric.com/ or https://intelliqs.zometric.com/
- On the home page, choose Statistical Tool> Anova >Test for Equal Variances
- Next, update the data manually or can completely copy (Ctrl+C) the data from excel sheet and paste (Ctrl+V) it here.
- Fill the required options.
- Finally, click on calculate at the bottom of the page and you will get desired results.
On the dashboard of Test for Equal Variances, the window is separated into two parts.
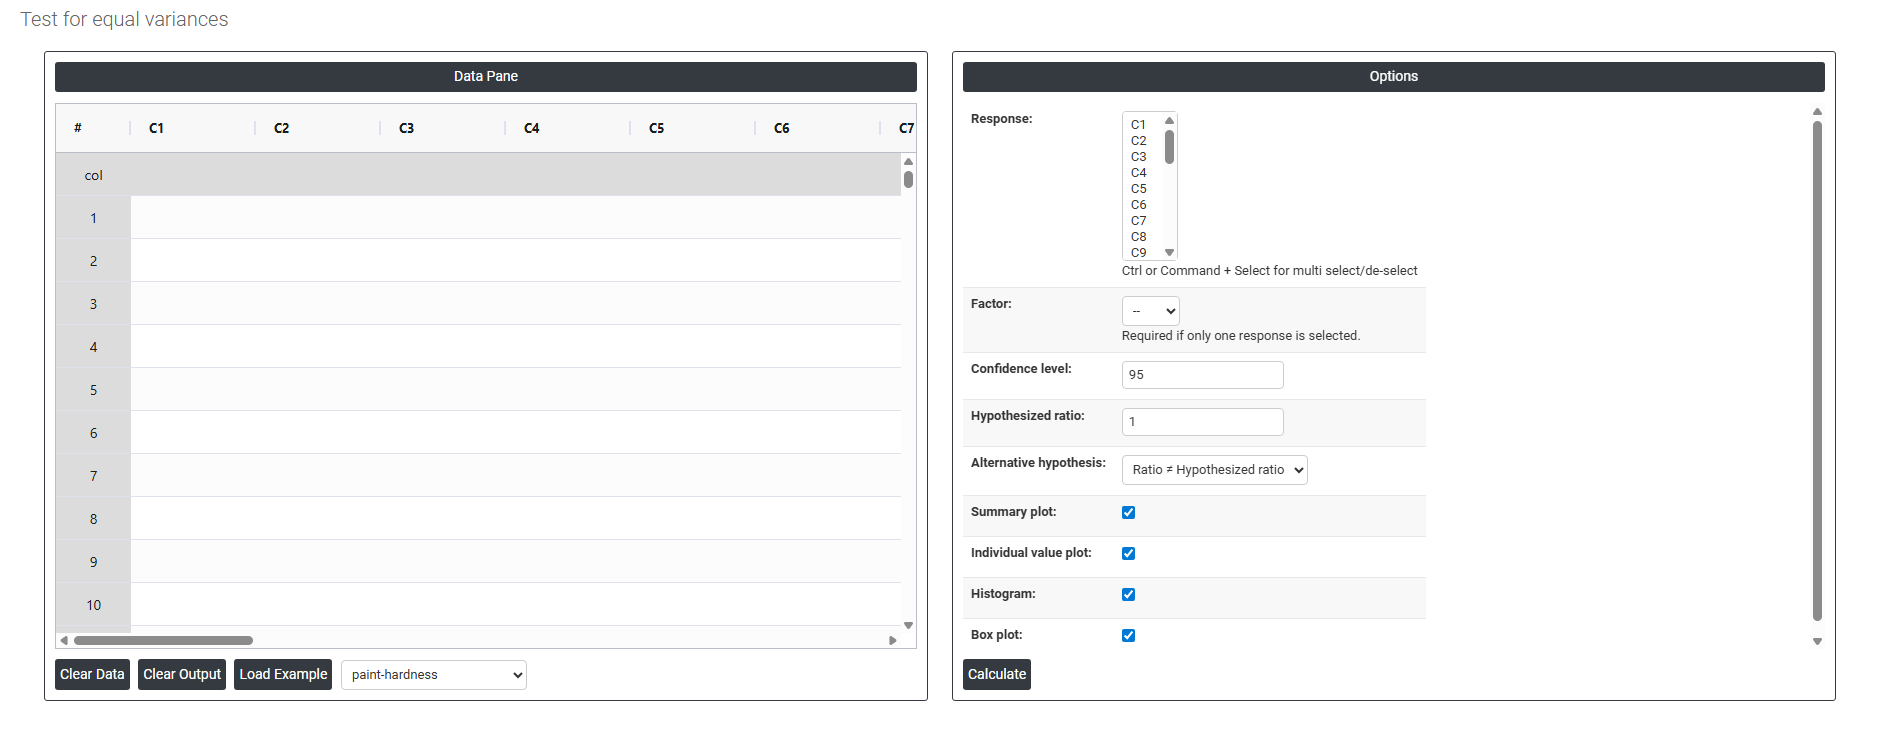
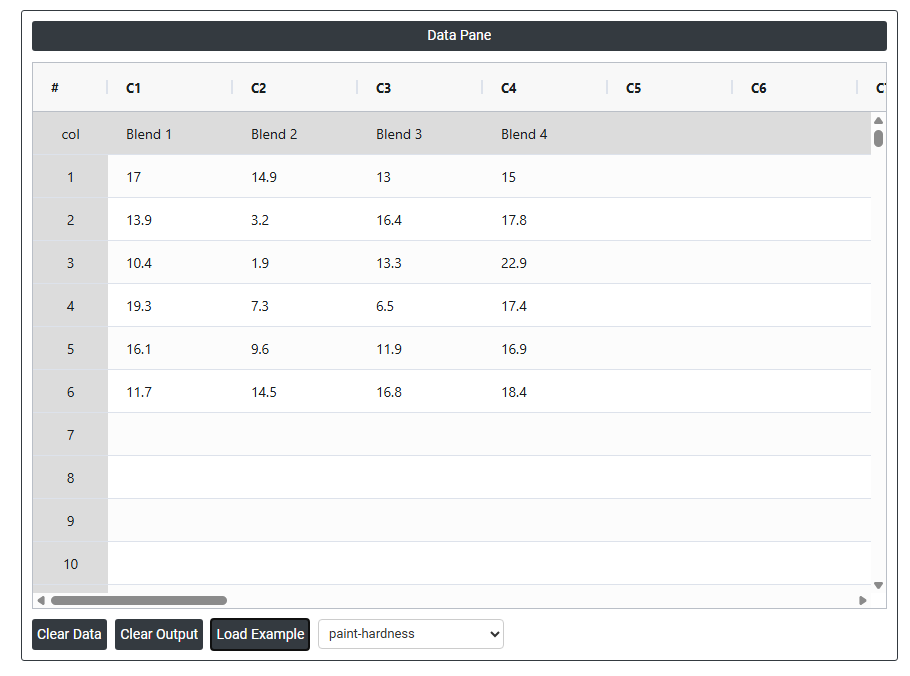
On the left part, Data Pane is present. In the Data Pane, each row makes one subgroup. Data can be fed manually or the one can completely copy (Ctrl+C) the data from excel sheet and paste (Ctrl+V) it here.
Load example: Sample data will be loaded.
Load File: It is used to directly load the excel data.
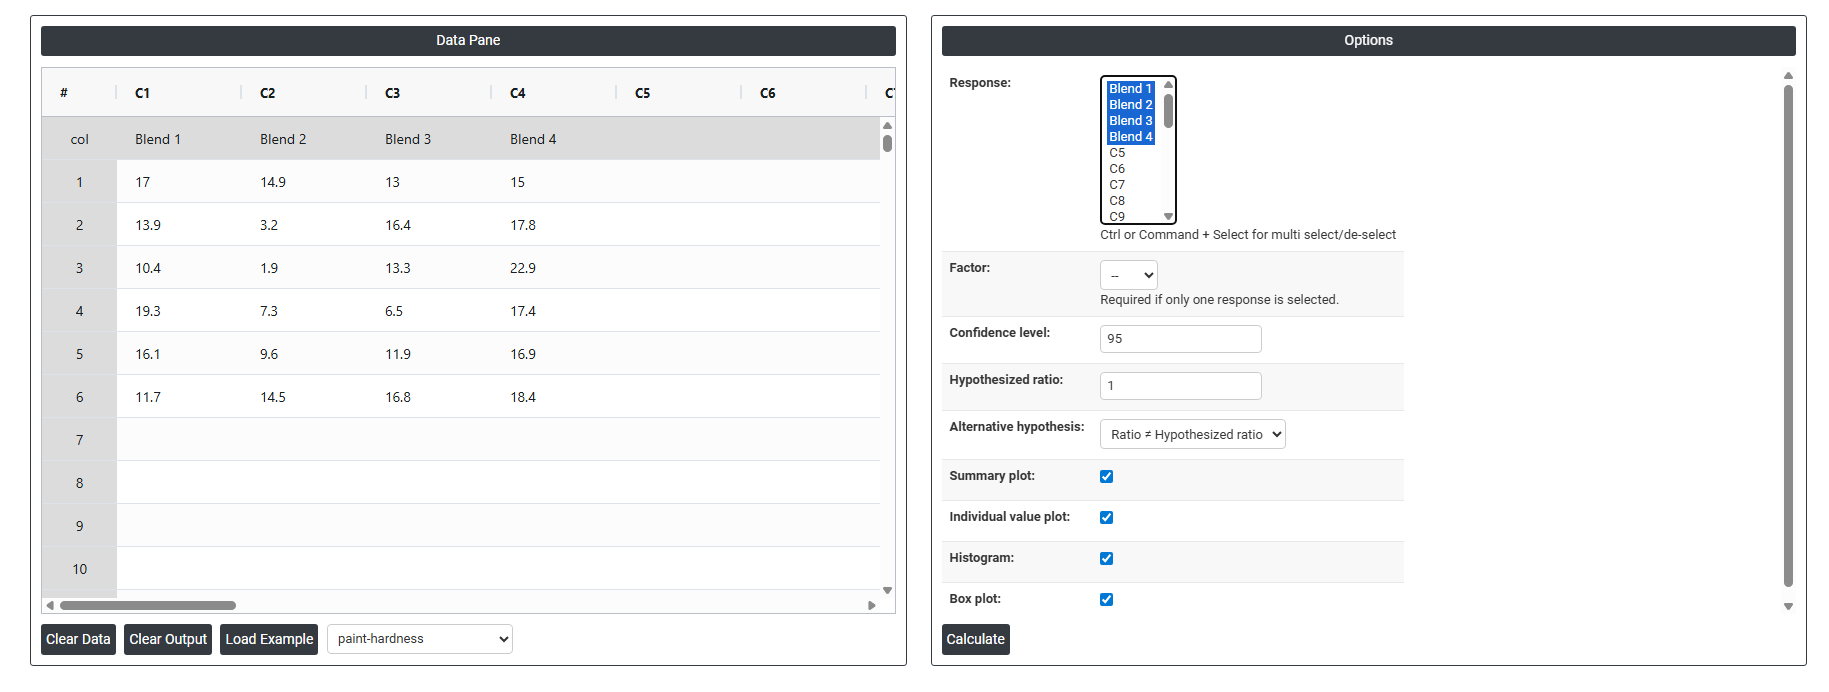
On the right part, there are many options present as follows:
- Response: Select the column(s) containing your continuous measurement data — the values whose variability you want to compare across groups. Use Ctrl or Command + Click to select multiple columns if your data for different groups is stored in separate columns. Each selected column represents one group or condition being compared.
- Factor: Select the column that identifies which group each observation belongs to — for example, machine type, operator, or material batch. This column is only required when all response data is stacked in a single column and a separate grouping variable is needed to distinguish between groups. If you have already selected multiple response columns (one per group), this field is not required.
- Confidence Level: Sets the certainty level for the confidence intervals displayed around each group's variance estimate. The default is 95%, meaning you are 95% confident the true variance for each group falls within the displayed interval. A higher confidence level (e.g. 99%) produces wider intervals; a lower level (e.g. 90%) produces narrower ones. The 95% default is the universally accepted standard for most statistical analyses.
- Hypothesized Ratio: The variance ratio you want to test against. The default is 1, which tests whether all groups have equal variance — a ratio of 1 means the variances are identical. If you have a specific known ratio from a prior study or engineering specification, you can enter it here to test whether your data is consistent with that expected ratio rather than testing for strict equality.
- Alternative Hypothesis: Defines the direction of the test — what you are trying to detect. The default option
- Ratio ≠ Hypothesized Ratio - is a two-sided test, meaning it detects variance differences in either direction (one group could be larger or smaller than the other). This is the appropriate choice in most situations when you have no prior expectation about which group should have greater variance.
- Summary Plot: When enabled, displays a summary chart showing the variance or standard deviation estimate for each group along with its confidence interval. This gives a quick visual overview of how the groups compare in terms of spread and whether their confidence intervals overlap — overlapping intervals suggest variances may be equal.
- Individual Value Plot: When enabled, displays every individual data point for each group plotted vertically. This helps you see the full distribution and spread of raw data within each group, identify any unusual observations or outliers, and understand the actual data behind the variance estimates before interpreting the test results.
- Histogram: When enabled, displays a histogram for each group showing the frequency distribution of the data. This is useful for visually assessing the shape of each group's distribution — particularly for checking whether the data is approximately normal before deciding which variance test (Bartlett, Levene, or Bonett) is most appropriate.
- Box Plot: When enabled, displays a box plot for each group showing the median, interquartile range, and any outliers. Box plots make it easy to visually compare the spread and centre of each group simultaneously — a group with a noticeably wider box has greater variability, which is a useful visual check before and after the formal test.