What is Tolerance(Normal Distribution Summarized) ?
When to use Tolerance(Normal Distribution Summarized) ?
- Use when raw data is unavailable but you have accurate summary statistics from a validated study or historical record.
- Use when working from supplier qualification reports, published research, or audit summaries where individual measurements were not retained.
- Use when you want to quickly evaluate tolerance bounds from existing summary data without re-running a full data collection exercise.
- Use only when the underlying data is confirmed or strongly expected to be normally distributed — this method is not valid for non-normal populations.
Guidelines for correct usage of Tolerance(Normal Distribution Summarized)
- Verify that the summary statistics are accurate, complete, and from a reliable source — errors in the inputs directly produce incorrect tolerance interval outputs.
- Ensure the original data that produced the summary statistics was normally distributed — this cannot be verified from summary statistics alone, so rely on prior knowledge or test documentation.
- Specify both the confidence level and the coverage proportion before running the analysis — these must reflect actual requirements, not post-hoc choices.
- Be aware that summary-based intervals cannot detect outliers or distributional irregularities that would be visible in raw data — use with appropriate caution.
Alternatives: When not to use Tolerance(Normal Distribution Summarized)
- If raw data is available, always use Tolerance Interval (Normal Distribution) instead — it provides better diagnostics and assumption validation.
- If the objective is to estimate a population mean rather than capture individual values, use a Confidence Interval from summary data.
Example of Tolerance(Normal Distribution Summarized)
The test in following steps:
- Filling the necessary Input.
- Now analyses the data with the help of https://qtools.zometric.com/ or https://intelliqs.zometric.com/.
- To find Tolerance(Normal Distribution Summarized) choose https://intelliqs.zometric.com/> Statistical module> Hypothesis Test> Tolerance(Normal Distribution Summarized).
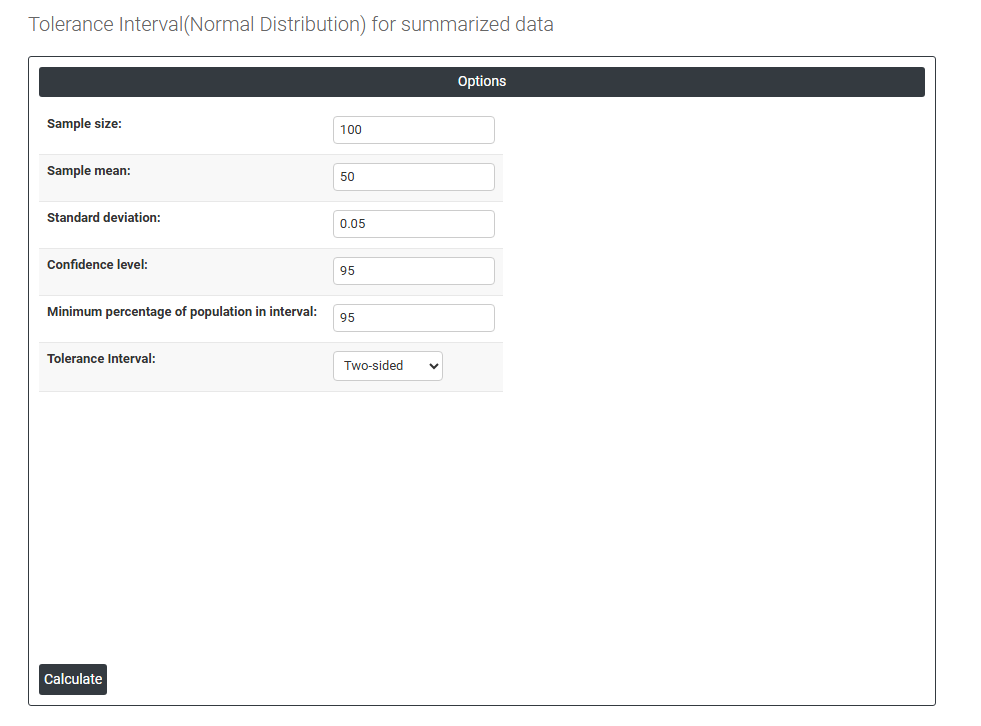
- Inside the tool, feeds the data as follows:
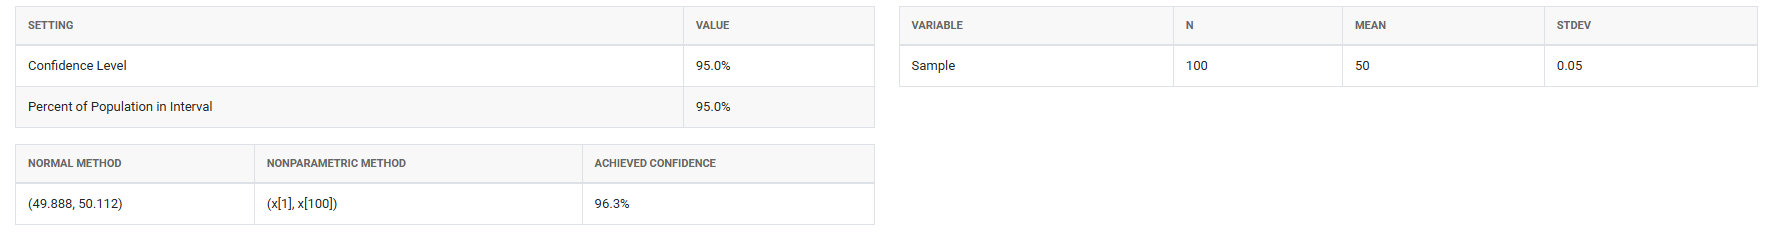
5. After using the above mentioned tool, fetches the output as follows:
How to do Tolerance(Normal Distribution Summarized)
The guide is as follows:
- Login in to QTools account with the help of https://qtools.zometric.com/ or https://intelliqs.zometric.com/
- On the home page, choose Statistical Tool> Hypothesis Test >Tolerance(Normal Distribution Summarized) .
- Next, update the data manually or can completely copy (Ctrl+C) the data from excel sheet and paste (Ctrl+V) it here.
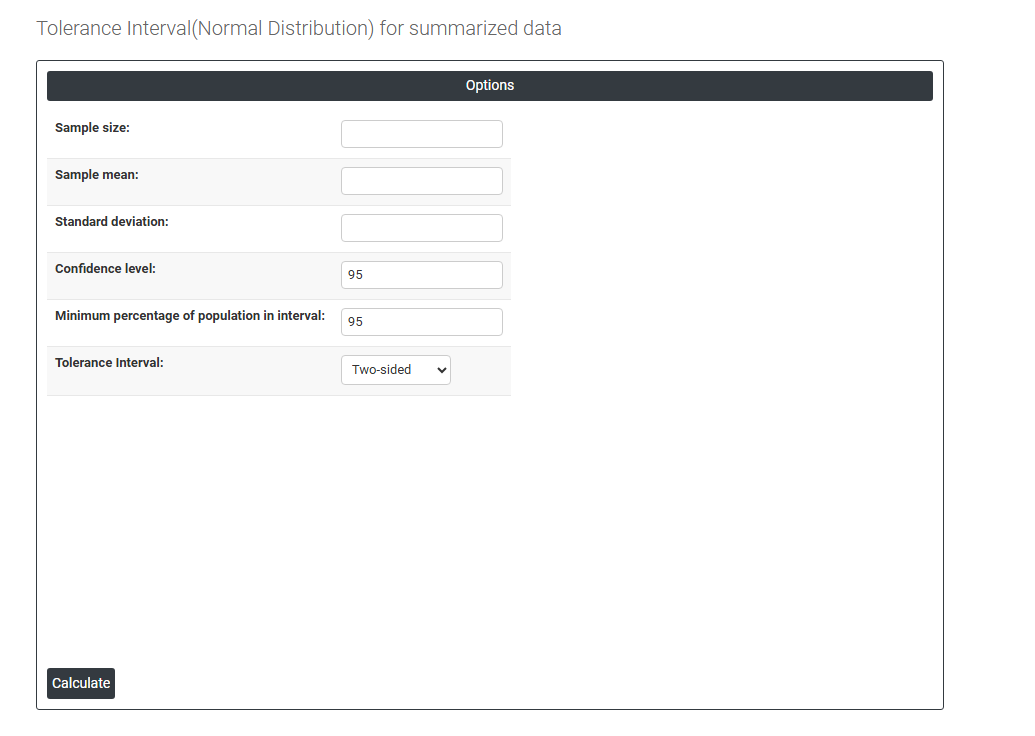
- Fill the required options.
- Finally, click on calculate at the bottom of the page and you will get desired results.
On the dashboard of Tolerance(Normal Distribution Summarized), the window is separated into two parts.
On the left part, Data Pane is present. In the Data Pane, each row makes one subgroup. Data can be fed manually or the one can completely copy (Ctrl+C) the data from excel sheet and paste (Ctrl+V) it here.
Load example: Sample data will be loaded.
Load File: It is used to directly load the excel data.
On the right part, there are many options present as follows:
- Sample Size: Enter the total number of observations that were collected in the original dataset — for example, if 50 energy cost measurements were taken, enter 50. This value is critical because the width of the tolerance interval is directly influenced by how many observations were used — larger sample sizes produce narrower, more precise intervals, while smaller sample sizes produce wider intervals that reflect greater uncertainty about the true population bounds.
- Sample Mean: Enter the average value of the original dataset. This is the central estimate around which the tolerance interval is built. The mean positions the interval on the measurement scale — a higher mean shifts the interval upward and a lower mean shifts it downward. Ensure this value is taken from a reliable and validated source, as an inaccurate mean directly shifts the entire interval to an incorrect location.
- Standard Deviation: Enter the standard deviation of the original dataset — representing how much individual measurements spread around the mean. This is the most influential input for determining the width of the tolerance interval. A larger standard deviation produces a wider interval reflecting more process variability; a smaller standard deviation produces a narrower interval reflecting a tighter, more consistent process. Ensure this value accurately represents the true process spread from the original study.
- Confidence Level: Sets the level of certainty that the calculated interval genuinely contains at least the specified proportion of the population. The standard default is 95%, meaning you are 95% confident the tolerance interval covers at least the minimum percentage of the population you specify. A higher confidence level (e.g. 99%) produces wider bounds with greater certainty; a lower level (e.g. 90%) produces narrower bounds but with reduced assurance that the coverage requirement is truly met.
- Minimum Percentage of Population in Interval: Enter the minimum proportion of the total population the tolerance interval must contain. For example, entering 99 means the interval is designed to capture at least 99% of all individual values from the process population. This value must be chosen based on quality requirements, product specifications, or regulatory standards — common choices are 90%, 95%, 99%, or 99.9% depending on the criticality of the application.
- Together with the confidence level, this defines the complete tolerance statement — for example, 95% confidence that at least 99% of the population falls within the interval is a widely accepted standard for process validation and product release documentation.
- Tolerance Interval: Defines the shape and direction of the tolerance interval. Three options are available:
- Two-Sided — produces both a lower and upper bound forming a complete range that captures the specified proportion of the population from both ends. Use when both the minimum and maximum individual values are important — for example, when a product must remain within both a lower and upper specification limit simultaneously.
- Lower Bound — produces only a lower boundary indicating the minimum value below which only a small proportion of the population is expected to fall. Use when only a minimum acceptable value matters — for example, confirming that at least 99% of products meet a minimum strength or purity requirement.
- Upper Bound — produces only an upper boundary indicating the maximum value above which only a small proportion of the population is expected to fall. Use when only a maximum acceptable value matters — for example, confirming that at least 99% of products remain below a maximum contamination, weight, or temperature limit.