What is Tolerance(Normal Distribution)?
When to use Tolerance(Normal Distribution)?
- Use when you need to confirm that a high proportion of process output will meet specification limits — for example, demonstrating that 99% of parts fall within tolerance.
- Use in process validation, product release, and regulatory submissions where you must demonstrate that future production will meet quality requirements.
- Use when specifications define acceptable limits for individual items rather than process averages — tolerance intervals apply to individual values, not means.
- Use when data is confirmed to follow a normal distribution — this method is optimised for normally distributed data.
Guidelines for correct usage of Tolerance(Normal Distribution)
- Confirm normality before using this method — use a normality test or probability plot first. If data is non-normal, the tolerance interval will be inaccurate.
- Larger sample sizes produce narrower, more precise tolerance intervals — small samples produce very wide intervals with limited practical value.
- Specify both the confidence level and the coverage proportion before analysis — for example, 95% confidence that 99% of the population is covered.
- Interpret the interval relative to specification limits — if the tolerance interval falls entirely within the specification, the process is capable of meeting requirements.
- Collect at least 30 data points for a meaningful tolerance interval — fewer observations produce excessively wide bounds.
Alternatives: When not to use Tolerance(Normal Distribution)
- If data is not normally distributed, use Nonparametric Tolerance Interval
- If you only have summary statistics (mean, SD, n) rather than raw data, use Tolerance Interval (Normal Distribution Summarized)
- If the goal is to estimate the population mean or a process parameter rather than capture individual values, use a Confidence Interval
- If assessing whether the process meets a capability requirement, use Capability Analysis (Normal)
Example of Tolerance(Normal Distribution)
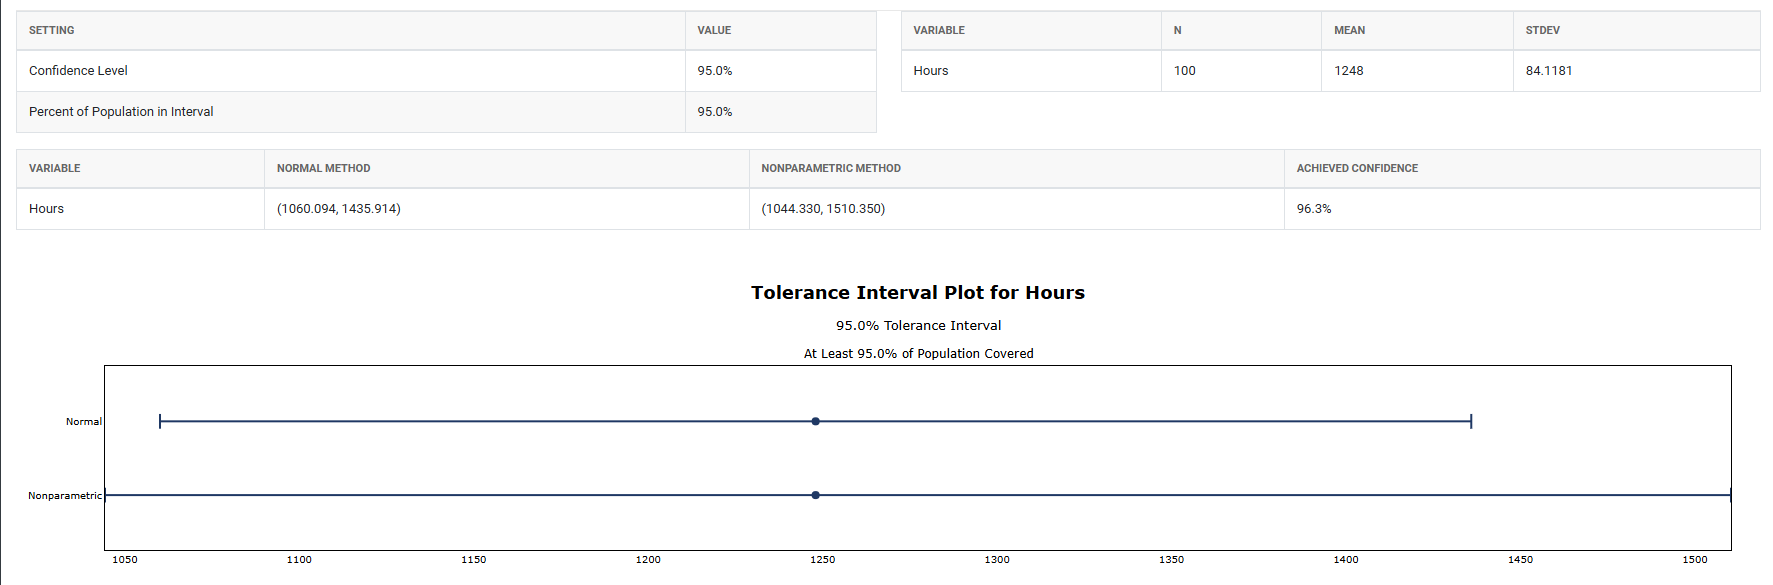
A quality engineer needs to evaluate how long light bulbs last in a manufacturing facility. A sample of 100 bulbs is tested and their individual burn times are recorded until each bulb fails. The goal is to establish a lower tolerance bound the minimum burn time that at least 95% of the entire light bulb population is expected to surpass. The test in following steps:
- Gathered the necessary data.
- Now analyses the data with the help of https://qtools.zometric.com/ or https://intelliqs.zometric.com/.
- To find Tolerance(Normal Distribution) choose https://intelliqs.zometric.com/> Statistical module> Hypothesis Test> Tolerance(Normal Distribution).
- Inside the tool, feeds the data along with other inputs as follows:
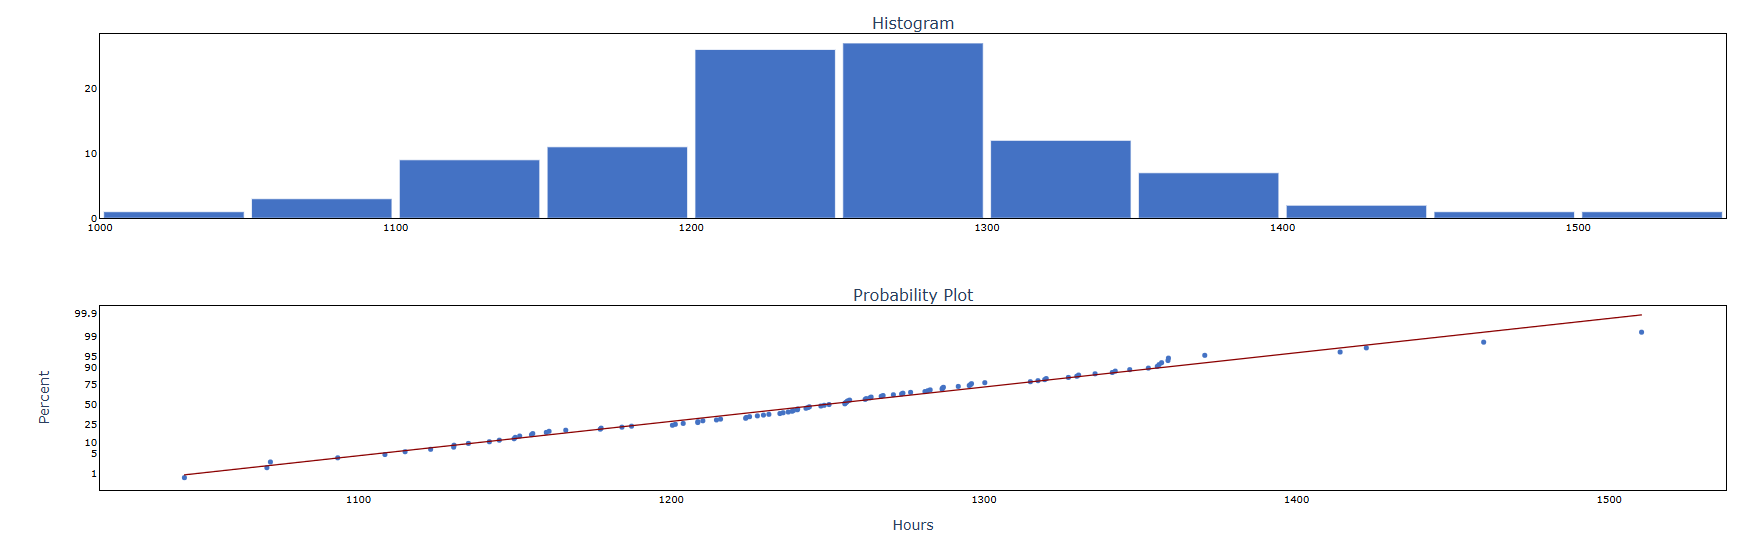
5. After using the above mentioned tool, fetches the output as follows:
How to do Tolerance(Normal Distribution)
The guide is as follows:
- Login in to QTools account with the help of https://qtools.zometric.com/ or https://intelliqs.zometric.com/
- On the home page, choose Statistical Tool> Hypothesis Test >Tolerance(Normal Distribution) .
- Next, update the data manually or can completely copy (Ctrl+C) the data from excel sheet and paste (Ctrl+V) it here.
- Fill the required options.
- Finally, click on calculate at the bottom of the page and you will get desired results.
On the dashboard of Tolerance(Normal Distribution), the window is separated into two parts.
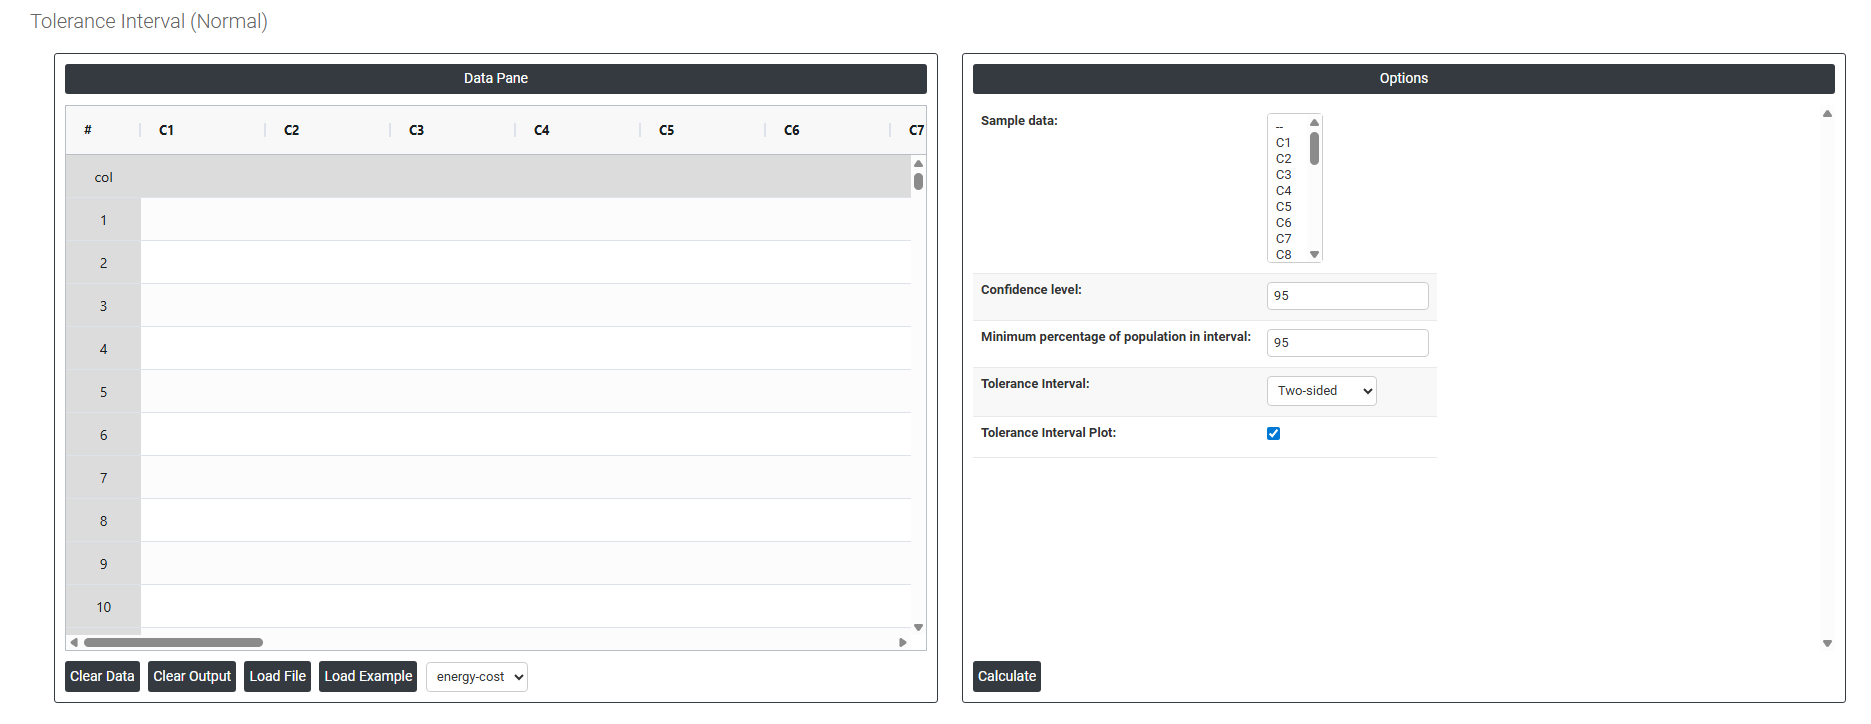
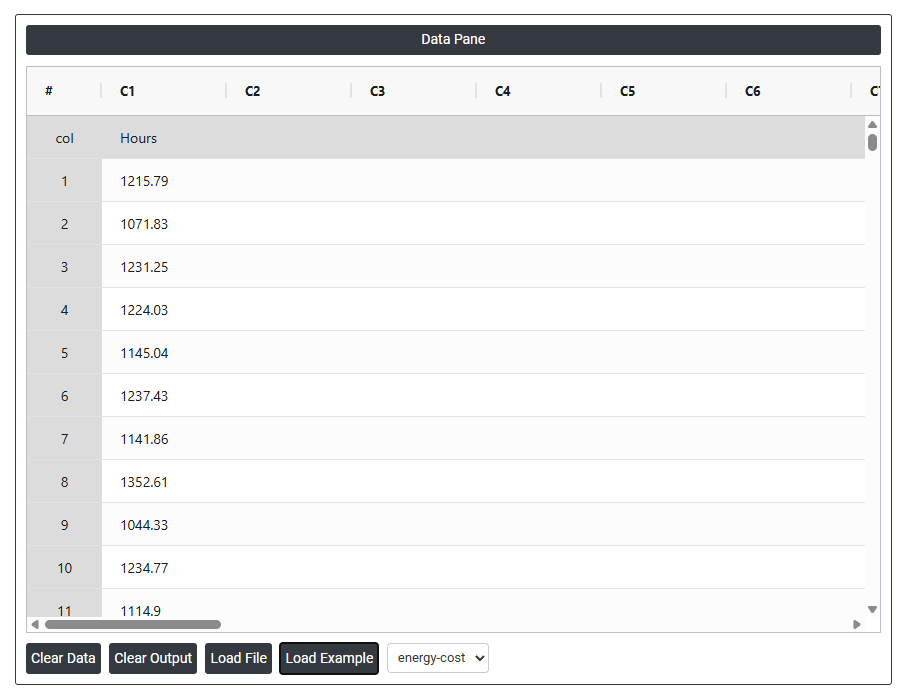
On the left part, Data Pane is present. In the Data Pane, each row makes one subgroup. Data can be fed manually or the one can completely copy (Ctrl+C) the data from excel sheet and paste (Ctrl+V) it here.
Load example: Sample data will be loaded.
Load File: It is used to directly load the excel data.
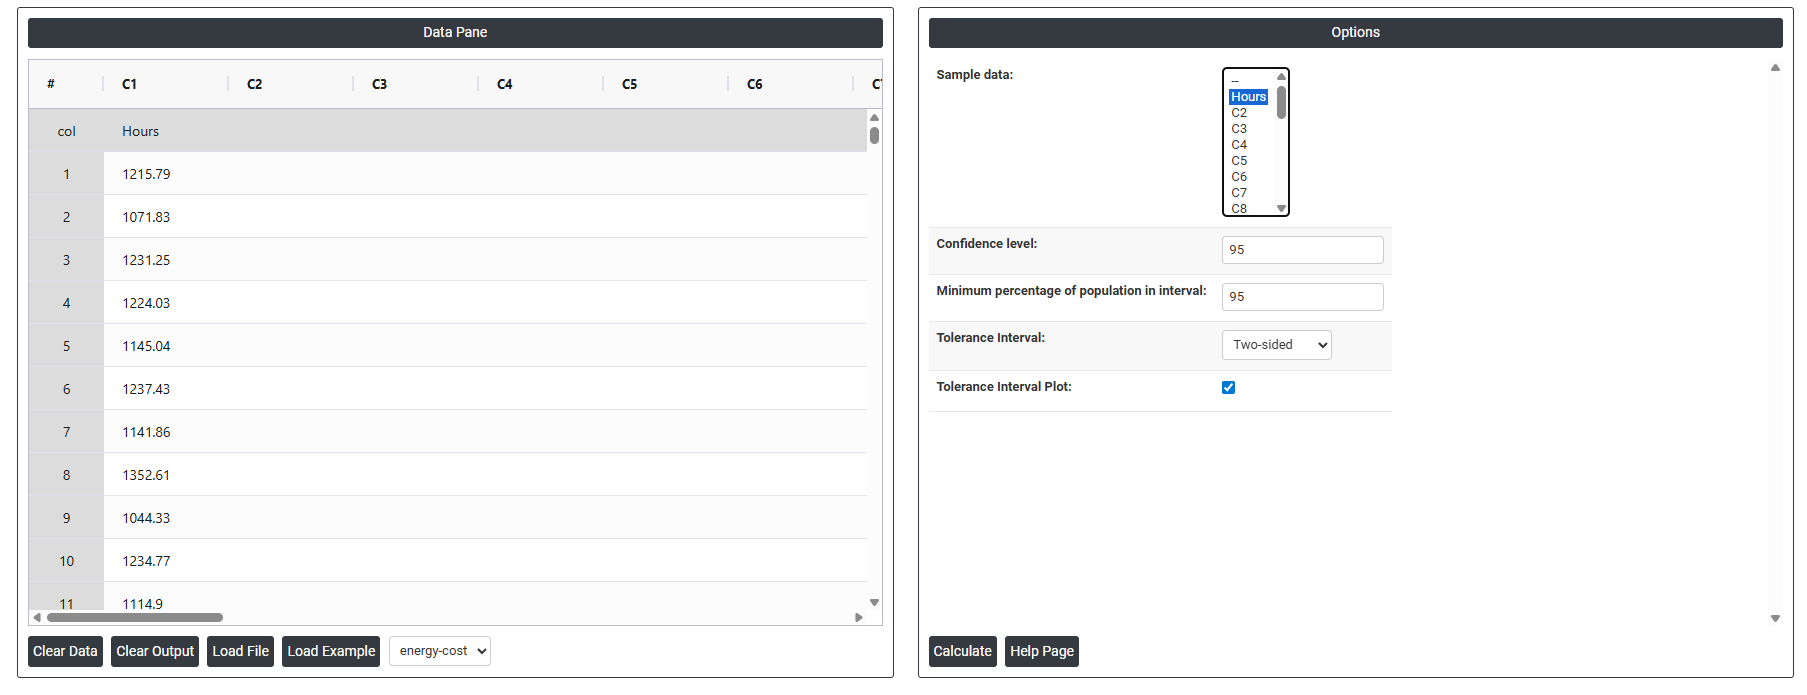
On the right part, there are many options present as follows:
- Sample Data: Select the column containing the raw continuous measurements you want to calculate a tolerance interval for — for example, energy costs, dimensions, weights, or temperatures. The tool uses all values in this column to estimate the process mean and standard deviation, which are then used to calculate the tolerance interval bounds. The data in this column must be approximately normally distributed for the results to be valid.
- Confidence Level: Sets the level of certainty that the calculated interval truly contains at least the specified proportion of the population. The standard default is 95%, meaning you are 95% confident that the tolerance interval covers at least the minimum percentage of population you specify. A higher confidence level (e.g. 99%) produces wider bounds with greater certainty; a lower level (e.g. 90%) produces narrower bounds but with less assurance that the true coverage is met.
- This is different from a confidence interval for the mean — here the confidence applies to how well the interval covers individual values across the entire population, not just the average.
- Minimum Percentage of Population in Interval: Enter the minimum proportion of the total population that the tolerance interval must contain. For example, entering 99 means the calculated interval is designed to capture at least 99% of all individual values from the process population. This value is chosen based on quality requirements, specifications, or regulatory standards — common choices are 90%, 95%, 99%, or 99.9% depending on how critical the application is.
- Together with the confidence level, this defines the complete tolerance statement. For example, 95% confidence that at least 99% of the population falls within the interval is a typical and widely accepted standard for process validation and product release.
- Tolerance Interval: Defines the shape and direction of the tolerance interval. Three options are available:
- Two-Sided — produces both a lower and upper bound, forming a complete range that captures the specified proportion of the population from both ends. Use when both the minimum and maximum individual values are important — for example, when a product must stay within both a lower and upper specification limit.
- Lower Bound — produces only a lower boundary, indicating the minimum value below which only a small proportion of the population is expected to fall. Use when only a minimum acceptable value matters — for example, confirming that at least 99% of products meet a minimum strength requirement.
- Upper Bound — produces only an upper boundary, indicating the maximum value above which only a small proportion of the population is expected to fall. Use when only a maximum acceptable value matters — for example, confirming that at least 99% of products remain below a maximum contamination or weight limit.
- Tolerance Interval Plot: When enabled, displays a visual plot showing the calculated tolerance interval bounds alongside the actual data points. The plot makes it easy to see how the interval relates to your data — whether the bounds are tight or wide relative to the data spread, whether any observed values fall near or outside the bounds, and how the interval compares to your specification limits. This visual confirmation is an important complement to the numerical output and helps communicate results clearly in reports and presentations.