What is Two Sample Equivalence test ?
When to use Two Sample Equivalence test?
- Use when comparing two independent groups and the goal is to demonstrate equivalence rather than detect a difference.
- Use when validating a new process, supplier, material, or method against an existing established standard.
- Use when regulatory submissions or quality audits require formal statistical evidence that two independent processes produce equivalent results.
- Use when the two groups have no pairing or matching between individual observations — each group is measured independently.
Guidelines for correct usage of Two Sample Equivalence test
- Define the equivalence interval in advance based on domain knowledge or regulatory requirements — it must represent the largest difference that is still practically acceptable.
- Ensure the two groups are truly independent — no observation in one group should be connected to any observation in the other.
- Both groups should have data that is approximately normally distributed, or sample sizes should be large enough for the Central Limit Theorem to apply.
- Use adequate sample sizes in both groups — equivalence tests require larger samples than standard tests to achieve reliable statistical power.
- Equivalence is confirmed only when the entire confidence interval for the difference falls within the equivalence boundaries — partial overlap is not sufficient.
Alternatives: When not to use Two Sample Equivalence test
- If the two groups are paired or matched, use Paired Equivalence Test
- If the objective is to detect a difference rather than confirm similarity, use Two Sample T Test
- If no meaningful equivalence interval can be specified, this test cannot be properly executed — a defined boundary is mandatory.
Example of Two Sample Equivalence test ?
A food science engineer wants to determine whether a new, less expensive formulation of cat food has the same protein content as the original product. To test this, the engineer collects 100-gram samples from both formulations and measures their protein content. Since the goal is to ensure the two formulations are equivalent in protein content within a margin of ±0.5 grams, the engineer performs a 2-sample equivalence test. The variances of the protein content in the two formulations are unknown and may not be equal. The test in following steps:
- Gathered the necessary data.
- Now analyses the data with the help of https://qtools.zometric.com/ or https://intelliqs.zometric.com/.
- To find Two Sample Equivalence test choose https://intelliqs.zometric.com/> Statistical module> Hypothesis Test> Two Sample Equivalence test.
- Inside the tool, feeds the data along with other inputs as follows:
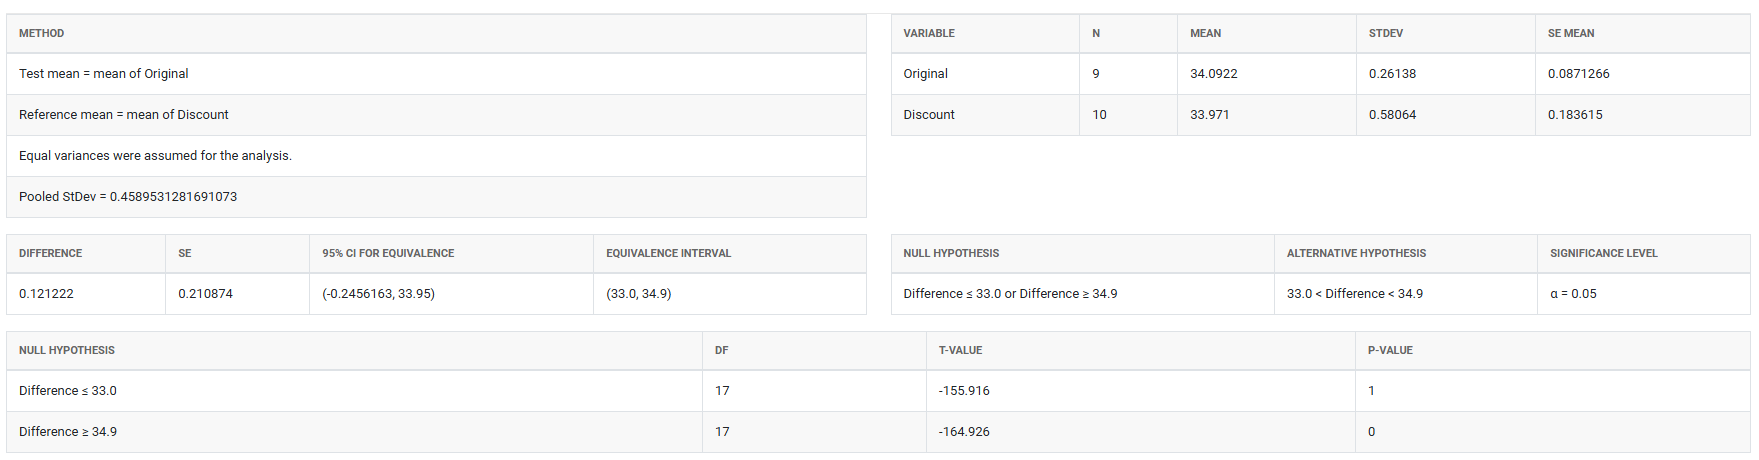
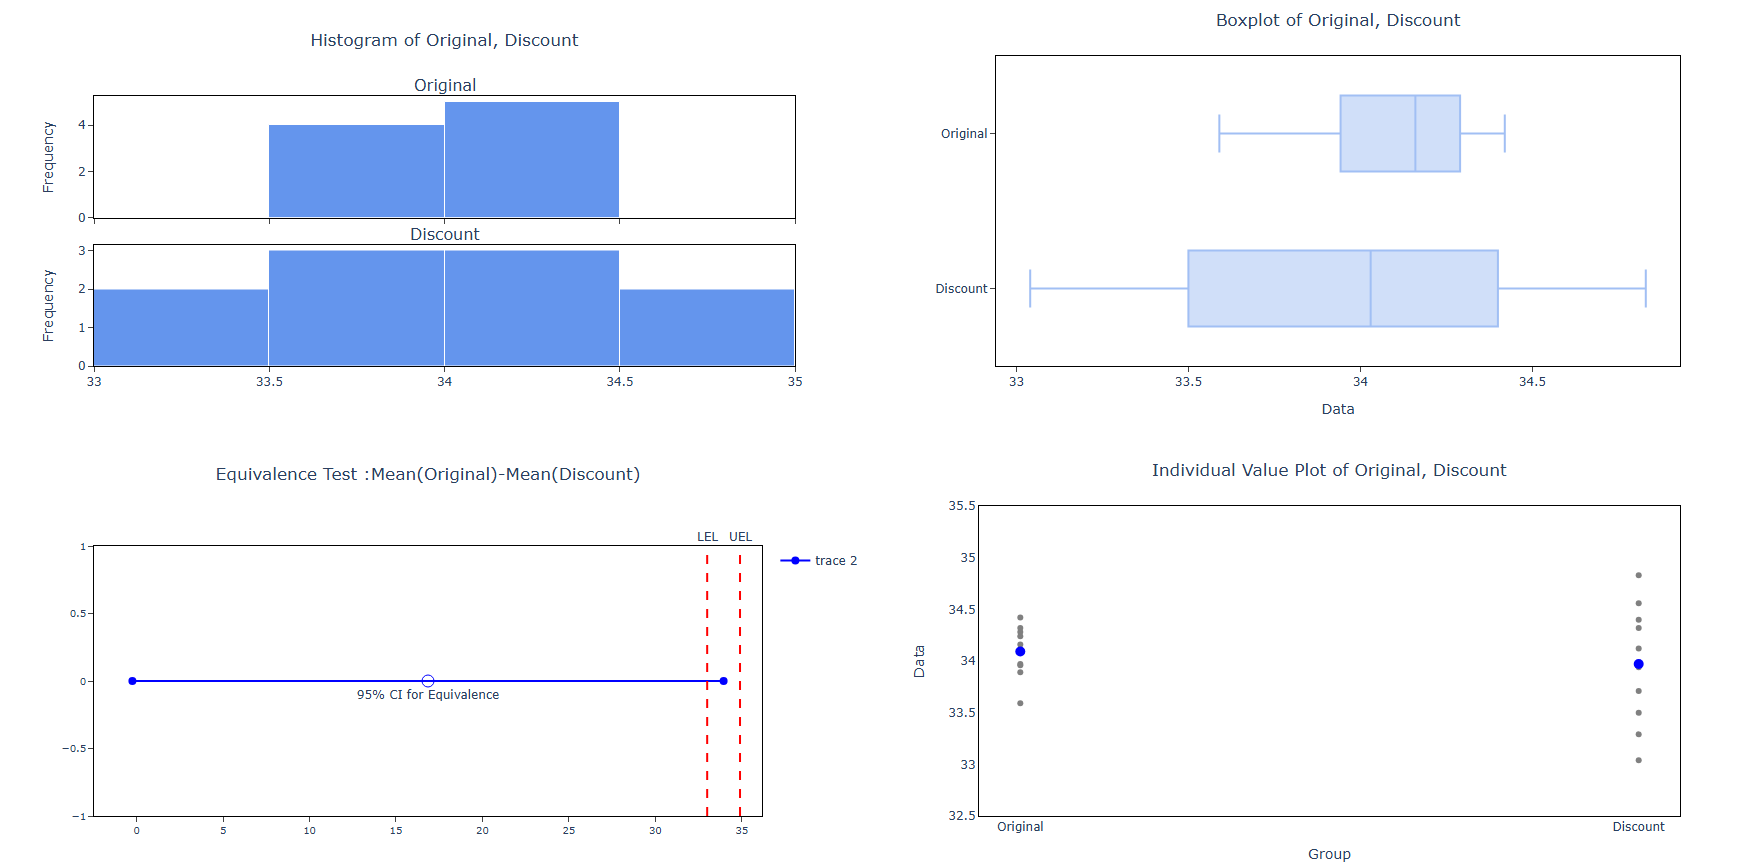
5. After using the above mentioned tool, fetches the output as follows:
How to do Paired Equivalence Test
The guide is as follows:
- Login in to QTools account with the help of https://qtools.zometric.com/ or https://intelliqs.zometric.com/
- On the home page, choose Statistical Tool> Hypothesis Test >Two Sample Equivalence test .
- Next, update the data manually or can completely copy (Ctrl+C) the data from excel sheet and paste (Ctrl+V) it here.
- Fill the required options.
- Finally, click on calculate at the bottom of the page and you will get desired results.
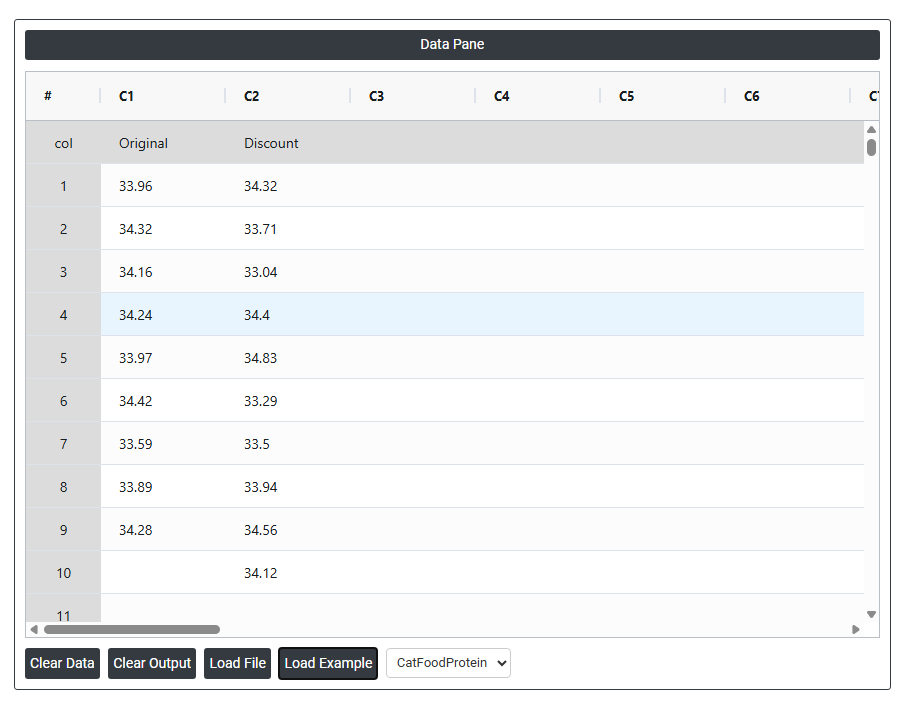
On the dashboard of Two Sample Equivalence test, the window is separated into two parts.
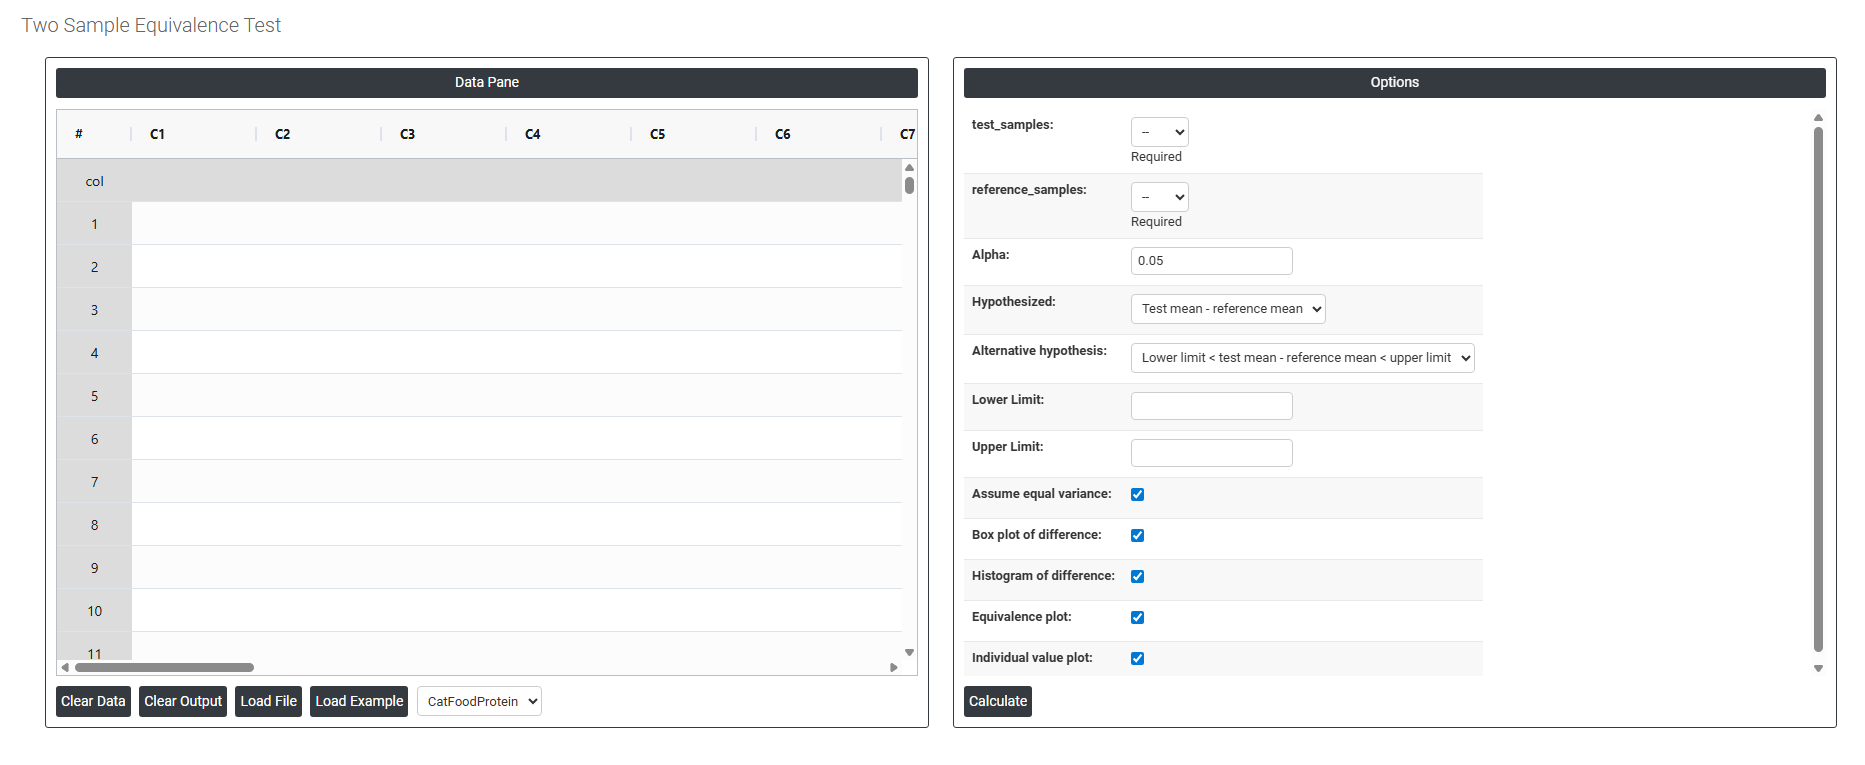
On the left part, Data Pane is present. In the Data Pane, each row makes one subgroup. Data can be fed manually or the one can completely copy (Ctrl+C) the data from excel sheet and paste (Ctrl+V) it here.
Load example: Sample data will be loaded.
Load File: It is used to directly load the excel data.
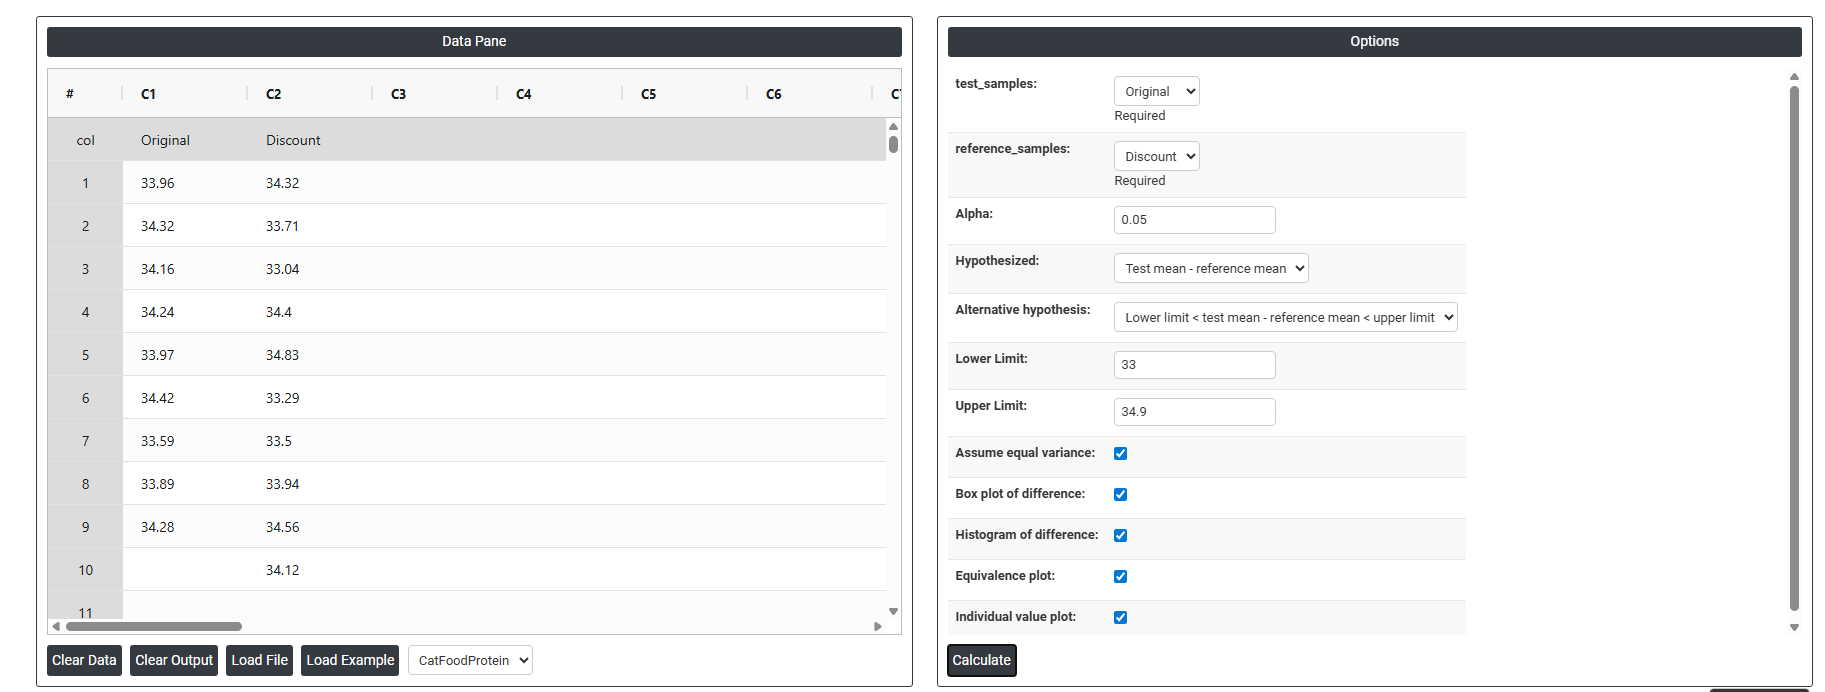
On the right part, there are many options present as follows:
- Test Samples Select the column containing measurements from the new or alternative group being evaluated — for example, readings from a discount supplier, a new formulation, or an updated process. This is the group you want to prove is equivalent to the established reference. This field is required.
- Reference Samples: Select the column containing measurements from the established or standard group that the test sample is being compared against — for example, data from the original supplier, the current formulation, or the existing process. Unlike the Paired Equivalence Test, the observations in this column do not need to correspond individually to observations in the Test Samples column — the two groups are completely independent of each other. This field is required.
- Alpha: Sets the significance level for the equivalence test. The standard default is 0.05, meaning there is a 5% risk of incorrectly concluding equivalence when the two groups are not truly equivalent. A smaller alpha (e.g. 0.01) requires stronger evidence before concluding equivalence and is used in higher-stakes or regulatory applications. Alpha must be defined before data collection begins.
- Hypothesized (Test Mean − Reference Mean): The assumed difference between the test group mean and the reference group mean being tested. In most equivalence studies this is set to 0, meaning you assume both groups should produce the same average result. If a known or acceptable systematic offset exists between the two groups, that value can be entered here instead.
- Alternative Hypothesis: Defines what the test is trying to prove:
- Lower Limit < Test Mean − Reference Mean < Upper Limit — confirms that the true average difference between the two groups falls entirely within the pre-defined equivalence boundaries. Equivalence is only concluded when the confidence interval for the difference is completely contained within both limits at the same time — partial overlap is not sufficient.
- Lower Limit The minimum acceptable difference: between the test and reference groups. This defines the lower boundary of the equivalence interval — if the average difference falls below this value, the test group is considered unacceptably lower than the reference. This boundary must be determined from scientific, regulatory, or practical requirements before the analysis, not derived from the data being tested.
- Upper Limit The maximum acceptable difference: between the test and reference groups. This defines the upper boundary of the equivalence interval — if the average difference exceeds this value, the test group produces unacceptably higher results than the reference. Together with the Lower Limit, it forms the complete equivalence window that the observed difference must fall within to declare the two groups equivalent.
- Assume Equal Variance: When checked, the test assumes both groups have the same underlying population variance and uses a pooled standard deviation in the calculation — producing a slightly more powerful test when this assumption holds. When unchecked, separate variance estimates are used for each group (Welch's approach), which is more reliable when the two groups have noticeably different spreads. If you are unsure, leave this unchecked as it is the more conservative and safer choice.
- Box Plot of Difference: When enabled, displays a box-and-whisker plot summarising the distribution of values in both groups and the difference between them. This provides a quick visual comparison of the centre, spread, and shape of each group — helping you assess whether any visible difference is practically meaningful or within acceptable bounds.
- Histogram of Difference: When enabled, displays a histogram of the difference between the two group distributions. This helps check whether the data meets the normality assumption and reveals whether differences are symmetrically distributed or show any unusual patterns that could affect the reliability of the test results.
- Equivalence Plot: When enabled, displays the primary results visual for the equivalence test — showing the confidence interval for the mean difference plotted against the lower and upper equivalence limits. If the entire confidence interval falls within both boundaries, equivalence is confirmed. This is the most critical output to review and should always be assessed alongside the p-value.
- Individual Value Plot: When enabled, displays every individual data point from both groups side by side. This gives a complete view of the full spread and distribution of each group — making it easy to spot outliers, skewness, or differences in variability that a summary plot alone might not reveal.