What is Two sample proportion test?
A two-sample proportion test is a statistical hypothesis test used to compare the proportions of a specific characteristic between two independent populations, determining if the observed difference is statistically significant, by calculating a confidence interval for the difference between the population proportions, and is applicable in fields like healthcare, economics, and survival analysis where proportions, rates, and percentages are more relevant than means or variances, given the assumptions of independence, random sampling, binary outcomes, and sufficient sample sizes are met.
When to use Two sample proportion test?
A two sample proportion test is used to determine whether there is a statistically significant difference between the proportions of two populations with respect to a certain characteristic.
- Comparing Proportions: When you need to compare the proportions of a specific characteristic between two independent populations or samples.
- Large Sample Size: Use the two-sample z-test for proportions when both samples are large enough, generally with at least 10 successes and 10 failures in each sample, to satisfy the conditions for normal approximation.
- Small Sample Size: For small sample sizes where the conditions for normal approximation are not met, use the Fisher's exact test, which is a non-parametric test that provides accurate results regardless of sample size.
- Binary Outcomes: When the data consists of binary outcomes (e.g., success/failure, yes/no) and you want to determine if the proportions differ significantly.
- Random Sampling: When the samples are randomly selected from their respective populations to ensure valid and representative results.
Here are some situations where you might use a two sample proportion test:
- Medical research: Suppose you are testing a new medication that is designed to reduce the risk of heart disease. You might conduct a two sample proportion test to compare the proportion of patients who develop heart disease in a treatment group (who receive the medication) and a control group (who do not receive the medication).
- Market research: Suppose you are conducting a survey to determine customer satisfaction with two different brands of a product. You might use a two sample proportion test to compare the proportion of customers who are satisfied with each brand.
- Quality control: Suppose you are testing the quality of two different manufacturing processes to determine which one produces more defective products. You might use a two sample proportion test to compare the proportion of defective products produced by each process.
Guidelines for correct usage of Two sample proportion test
- Random Sampling: Ensure the sample data is randomly selected to make valid generalizations about the population.
- Binary Data: The data should consist of only two categories (e.g., pass/fail, 1/0). For count data, use a 2-Sample Poisson Rate test.
- Independence of Observations: Each observation should be independent of all other observations.
- Appropriate Sample Size: Ensure the sample size is large enough to provide precise estimates, narrow confidence intervals, and adequate protection against type I and type II errors.
Alternatives: When not to use Two sample proportion test
- If your dataset consists of counts, like the number of defects per unit, it is appropriate to use the 2-Sample Poisson Rate test.
Example of Two sample proportion test?
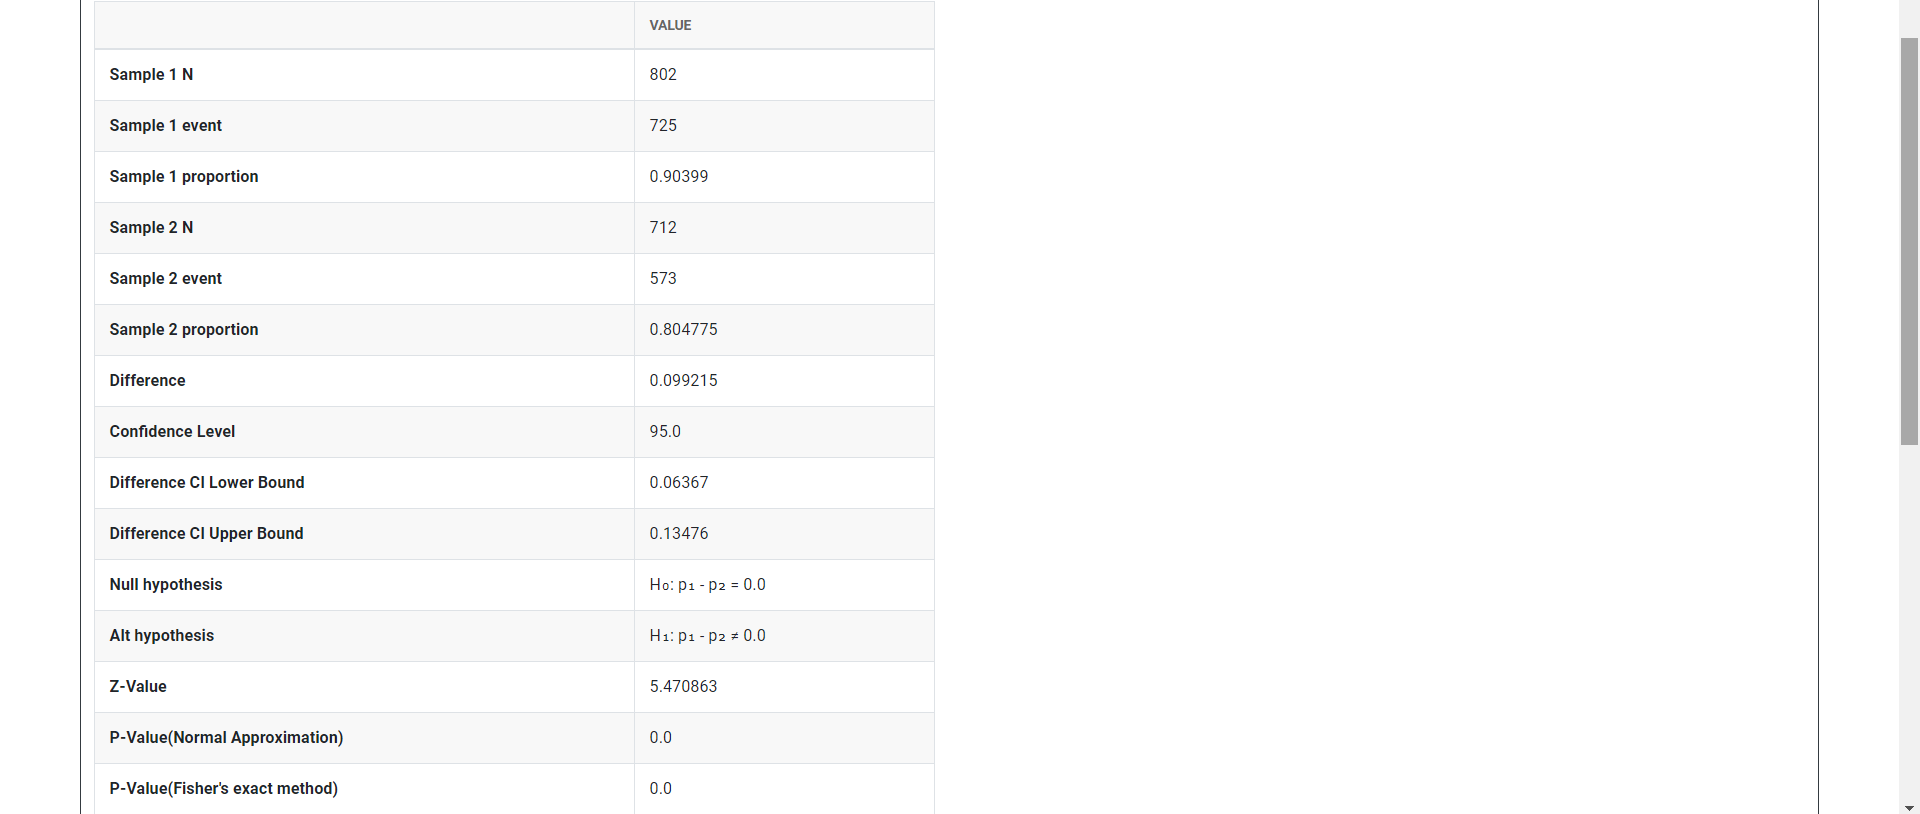
To assess whether male or female undergraduate students are more likely to obtain a summer job, a university financial aid officer selects a sample of students. Out of 802 male students sampled, 725 obtain a job during the summer, while 573 out of 712 female students sampled obtain a job. The financial aid officer uses a 2 proportions test to evaluate which gender is more likely to obtain a summer job. The following steps:
- Analyzes the data with the help of https://qtools.zometric.com/
- Inside the tool, feed the data. Put number of events in sample 1 as 725, number of trials in sample 1 as 802, number of events in sample 2 as 573, number of trials in sample 2 as 712, hypothesized difference as 0 and confidence level as 95.
- After using the above mentioned tool, fetch the output as follows:
How to do Two sample proportion test
The guide is as follows:
- Login in to QTools account with the help of https://qtools.zometric.com/or https://intelliqs.zometric.com/
- On the home page, choose Statistical Tool> Graphical analysis >Two sample proportion test .
- Click on Two sample proportion test and reach the dashboard.
- Next, update the data manually or can completely copy (Ctrl+C) the data from excel sheet and paste (Ctrl+V) it here.
- Next, you need to put the values of number of events, number of trials, hypothesized proportion and confidence level.
- Finally, click on calculate at the bottom of the page and you will get desired results.
On the dashboard of Two sample proportion test, the window has only left part.
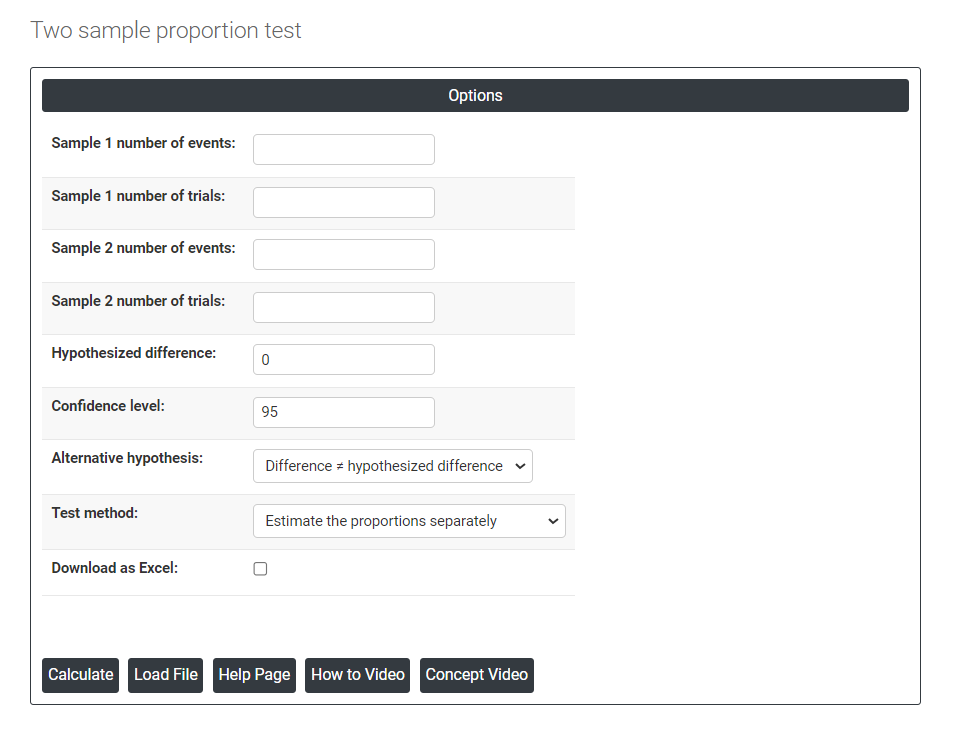
In this left part, there are many options present as follows:
- Number of events: In a one sample proportion test, the number of events refers to the number of occurrences of the event of interest in the sample being analyzed.
- Number of trials: In a one sample proportion test, the number of trials refers to the number of independent, identical trials or observations made on the sample being analyzed.
- Hypothesized difference: The hypothesized difference refers to the difference in the population parameters between the null hypothesis and the alternative hypothesis. For example, if we want to test whether the mean score on a test is significantly different between two groups (e.g., males and females), the hypothesized difference would be the difference between the mean score of males and the mean score of females.
- Confidence level: In hypothesis testing, the confidence level represents the degree of certainty or level of confidence that we have in our statistical analysis. It is a probability value that indicates the likelihood that the true population parameter falls within the specified range of values. Typically, the confidence level is expressed as a percentage and is denoted by (1 - α), where α is the level of significance or the probability of rejecting a true null hypothesis. For example, if we have a confidence level of 95%, then we are saying that we are 95% confident that the true population parameter lies within our interval estimate, and there is a 5% chance of making a type I error (rejecting a true null hypothesis). In practical terms, a higher confidence level means that we are more confident in our statistical analysis and results. However, increasing the confidence level also increases the width of the confidence interval, making it more difficult to detect small effects. Therefore, the choice of the confidence level depends on the context of the study and the goals of the researcher.
- Alternative hypothesis: In hypothesis testing, the alternative hypothesis (also called the research hypothesis) is a statement that represents a different conclusion than the null hypothesis. The null hypothesis typically represents the status quo or the assumption that there is no significant difference or relationship between two or more groups or variables. The alternative hypothesis is the statement that is being tested, and it proposes that there is a significant difference or relationship between the groups or variables being studied.
- Load example: Sample data will be loaded.
- Method:
- Estimate the proportions separately: To estimate the proportions separately in a two sample proportion test, you need to first collect data from two independent samples and calculate the proportion of successes (or the event of interest) for each sample.
- Use the pooled estimate of the proportion: In a two sample proportion test, the pooled estimate of the proportion is a weighted average of the proportions from the two samples, assuming that the true proportions in the populations are equal. This estimate is used to calculate the test statistic and determine whether the difference in proportions between the two samples is statistically significant.