
One variance test
A one-variance test, specifically the Chi-Square Test for One Variance, is a statistical test used to compare the variance of a sample to a known population variance. It is employed to test a hypothesis about the population variance, with the assumption that the sample is drawn from a normally distributed population.
Last reviewed
Key takeaway
A one-variance test, specifically the Chi-Square Test for One Variance, is a statistical test used to compare the variance of a sample to a known population variance.
On this page
What is One variance test?
A one-variance test, specifically the Chi-Square Test for One Variance, is a statistical test used to compare the variance of a sample to a known population variance. It is employed to test a hypothesis about the population variance, with the assumption that the sample is drawn from a normally distributed population. The null hypothesis (H₀) states that the population variance (σ²) is equal to a specified value (σ₀²), while the alternative hypothesis (H₁) posits that the variance is different from this value. The test statistic is calculated as (n−1)*s^2/σ0^2, where s^2 is the sample variance, σ0^2 is the hypothesized population variance, and n is the sample size. This statistic follows a chi-square distribution with n−1 degrees of freedom, allowing for the assessment of whether the observed variance significantly deviates from the hypothesized variance. This test is typically used in quality control, risk management, and experimental research to evaluate if observed variability meets theoretical expectations or standards.
When to use One variance test?
- Assessing Variance: When you need to determine if the variance of a single sample significantly differs from a known population variance.
- Chi-Square Test: Specifically, when using the Chi-Square Test for One Variance, which compares the sample variance to a specified population variance based on the assumption that the sample is drawn from a normally distributed population.
- Normal Distribution: When the data is assumed to follow a normal distribution, as the test relies on this assumption for accurate results.
- Quality Control: To evaluate if the variability of a production process or product matches the expected standard or specification.
- Risk Management: To assess whether the variability of financial returns, operational metrics, or other indicators aligns with predefined risk levels or thresholds.
- Experimental Research: To test if the observed variability in experimental data conforms to theoretical predictions or expected values.
- Consistency Testing: When evaluating the consistency of measurements or process outputs against known standards or benchmarks.
Guidelines for correct usage of One variance test
- Random Sampling: Ensure the sample data is randomly selected to make valid generalizations about the population.
- Data Distribution: The sample data should not be severely skewed. For the Bonett method, a sample size greater than 40 is recommended, even with mildly skewed data. For smaller samples, check for skewness and unusual observations, and use caution with data from distributions with heavy tails. [Note: Use the chi-square method only if the data is normally distributed, as deviations can significantly affect results.]
- Independence of Observations: Each observation should be independent of all others. Dependent observations can invalidate the results.
- Appropriate Sample Size: Ensure the sample size is large enough to provide precise estimates, narrow confidence intervals, and adequate protection against type I and type II errors.
Alternatives: When not to use One variance test
- Small sample size: One variance test requires a minimum sample size to ensure statistical power. If the sample size is small, the test may not be reliable, and alternative tests such as the t-test may be more appropriate.
Example of One variance test?
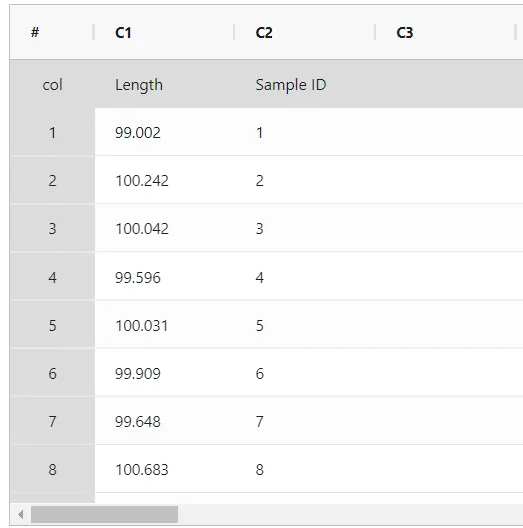
A lumber yard's manager is evaluating the saw mill's efficiency in cutting beams that are meant to be 100 cm long. To do so, the manager takes a sample of 50 beams from the saw mill and measures their lengths. Subsequently, the manager conducts One variance test to determine if the saw mill's standard deviation is significantly different from 1. The following steps:
- Gathered the necessary data.
- Now analyses the data with the help of https://qtools.zometric.com/ or https://intelliqs.zometric.com/.
- To find One variance test choose https://intelliqs.zometric.com/> Statistical module> Graphical analysis> One variance test.
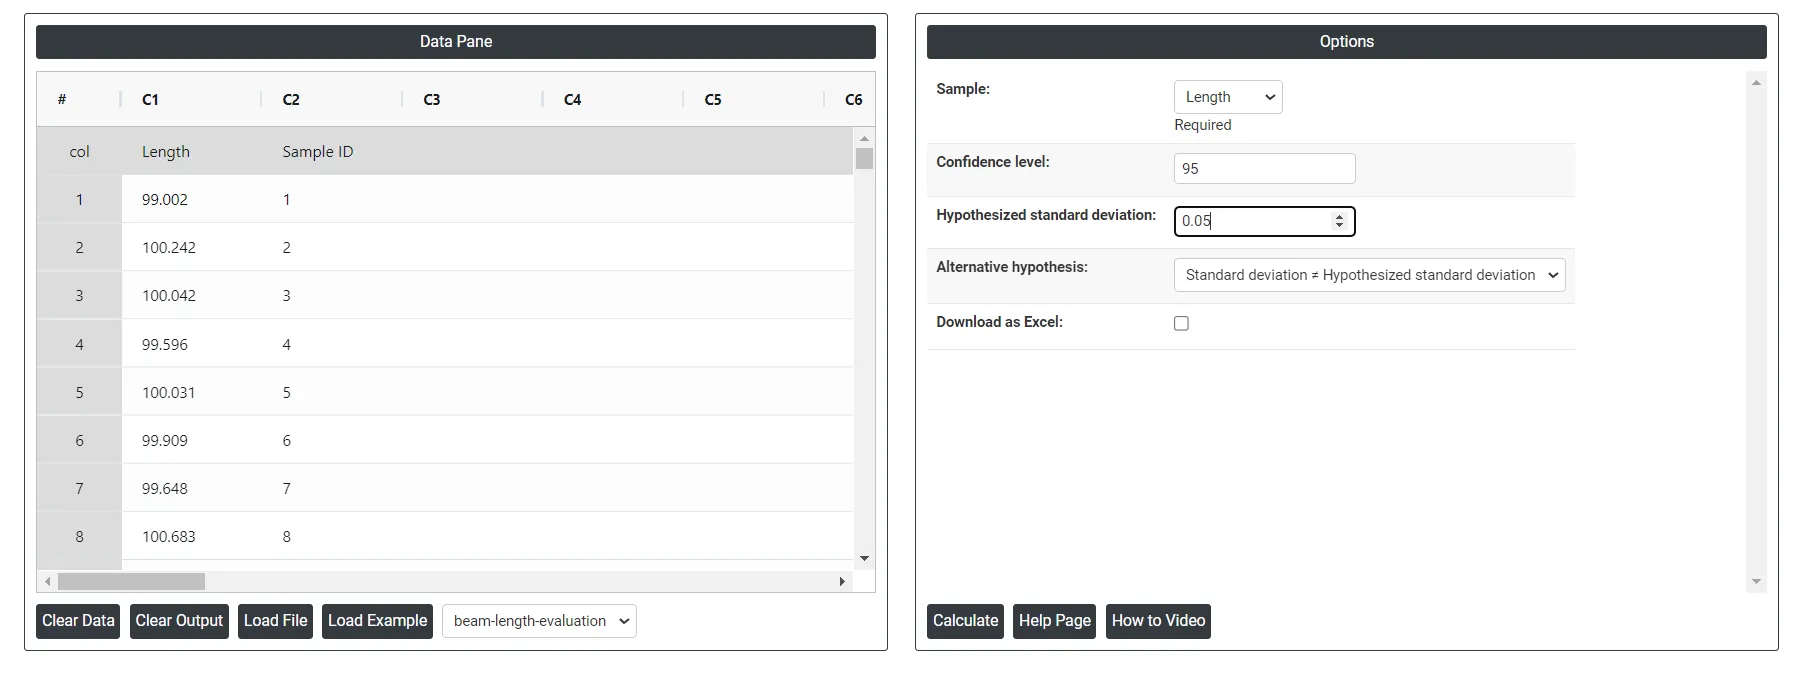
- Inside the tool, feeds the data along with other inputs as follows:
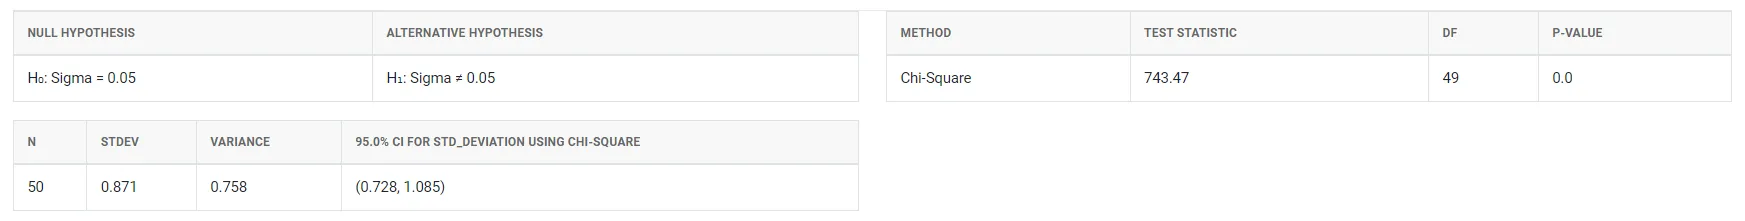
5. After using the above mentioned tool, fetches the output as follows:
How to do One variance test
The guide is as follows:
- Login in to QTools account with the help of https://qtools.zometric.com/ or https://intelliqs.zometric.com/
- On the home page, choose Statistical Tool> Graphical analysis >One variance test
- Click on One variance test and reach the dashboard.
- Next, update the data manually or can completely copy (Ctrl+C) the data from excel sheet and paste (Ctrl+V) it here.
- Next, you need to put the values of confidence level and hypothesized standard deviation.
- Finally, click on calculate at the bottom of the page and you will get desired results.
On the dashboard of One variance test, the window is separated into two parts.
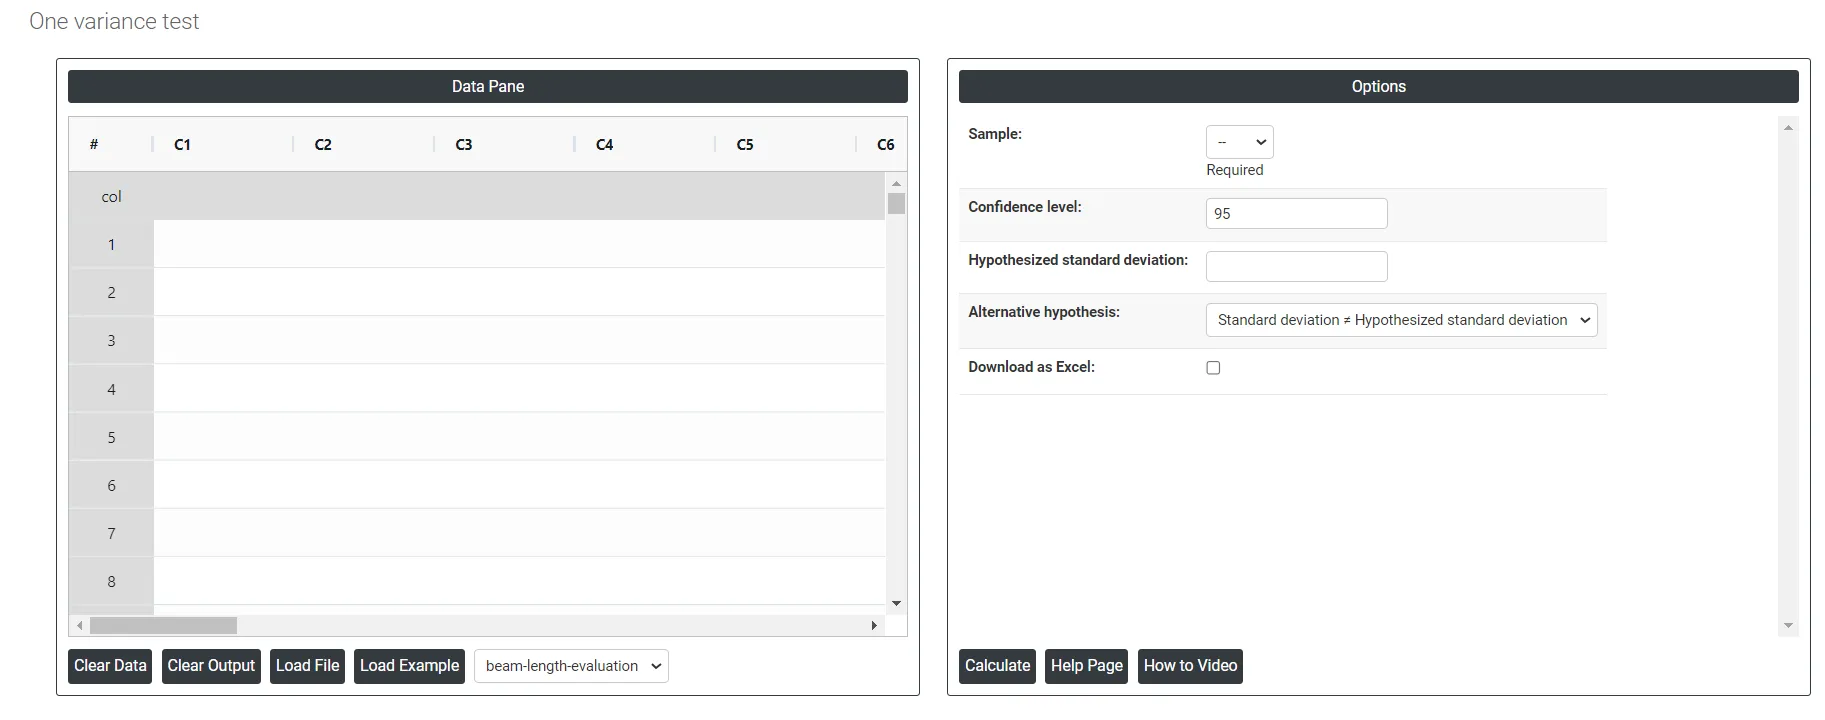
On the left part, Data Pane is present. In the Data Pane, each row makes one subgroup. Data can be fed manually or the one can completely copy (Ctrl+C) the data from excel sheet and paste (Ctrl+V) it here.
Load example: Sample data will be loaded.
Load File: It is used to directly load the excel data.
On the right part, there are many options present as follows:
- Confidence level: In hypothesis testing, the confidence level represents the degree of certainty or level of confidence that we have in our statistical analysis. It is a probability value that indicates the likelihood that the true population parameter falls within the specified range of values. Typically, the confidence level is expressed as a percentage and is denoted by (1 - α), where α is the level of significance or the probability of rejecting a true null hypothesis. For example, if we have a confidence level of 95%, then we are saying that we are 95% confident that the true population parameter lies within our interval estimate, and there is a 5% chance of making a type I error (rejecting a true null hypothesis). In practical terms, a higher confidence level means that we are more confident in our statistical analysis and results. However, increasing the confidence level also increases the width of the confidence interval, making it more difficult to detect small effects. Therefore, the choice of the confidence level depends on the context of the study and the goals of the researcher.
- Hypothesized standard deviation: The hypothesized standard deviation, also known as the assumed standard deviation or the known standard deviation, is the value of the population standard deviation that is assumed to be true for the purpose of a hypothesis test.
- Alternative hypothesis: In hypothesis testing, the alternative hypothesis (also called the research hypothesis) is a statement that represents a different conclusion than the null hypothesis. The null hypothesis typically represents the status quo or the assumption that there is no significant difference or relationship between two or more groups or variables. The alternative hypothesis is the statement that is being tested, and it proposes that there is a significant difference or relationship between the groups or variables being studied.
- Download as Excel: This will display the result in an Excel format, which can be easily edited and reloaded for calculations using the load file option.