
Two variance test
A two-variance hypothesis test assesses whether the variances of two independent populations are equal by comparing the ratio of the two sample variances using the F-distribution with distinct degrees of freedom for each sample, based on the assumptions that the populations are normally distributed and independent, and is often applied in quality control, finance, and experimental research to evaluate process consistency and variability.
Last reviewed
Key takeaway
A two-variance hypothesis test assesses whether the variances of two independent populations are equal by comparing the ratio of the two sample variances using the…
On this page
What is Two variance test?
A two-variance hypothesis test assesses whether the variances of two independent populations are equal by comparing the ratio of the two sample variances using the F-distribution with distinct degrees of freedom for each sample, based on the assumptions that the populations are normally distributed and independent, and is often applied in quality control, finance, and experimental research to evaluate process consistency and variability.
When to use Two variance test?
The two-sample variance test is used to determine whether two samples of data have equal variances.
- Comparing Variabilities: When you need to determine if the variability (variance) of two independent populations is significantly different.
- Quality Control: To compare the consistency and variability of two different production processes or batches.
- Experimental Research: When evaluating whether the experimental conditions or treatments result in different levels of variability in the outcomes.
- Finance: To compare the risk (variance in returns) of two different investment portfolios or financial instruments.
- Assumptions Met:
- Normal Distribution: The populations from which the samples are drawn must be normally distributed.
- Independence: The two populations must be independent of each other.
It is useful in situations where you want to compare two populations or groups with respect to their variances, such as in the following scenarios:
- Quality control: A manufacturing company may want to compare the variances of two production lines to ensure that they are producing products with consistent quality.
- Clinical trials: Researchers may want to compare the variances of two groups of patients to determine if a new treatment has a similar effect on both groups.
- Education: Educators may want to compare the variances of test scores between two groups of students to see if one group is more consistent than the other.
- Financial analysis: Investors may want to compare the variances of the returns on two different investment portfolios to determine if one is more volatile than the other.
Guidelines for correct usage of Two variance test
- Random Sampling: Ensure the sample data is randomly selected to make valid generalizations about the population.
- Data Distribution: The sample data should not be severely skewed, and sample sizes should be greater than 20. If sample sizes are less than 20, graph the data to check for skewness and unusual observations. Use caution when interpreting results if the data is severely skewed or has many unusual observations.
- Independence of Observations: Each observation should be independent of all other observations. Dependent observations can invalidate the results.
- Appropriate Sample Size: Ensure the sample size is large enough to provide precise estimates, narrow confidence intervals, and adequate protection against type I and type II errors.
Alternatives: When not to use Two variance test
- The two-sample variance test is designed for comparing the variances of two independent samples. If your samples are dependent, such as in a before-after study or a matched-pair design, you may need to use a different test such as the paired t-test.
Example of Two variance test?
A consultant in the healthcare industry aims to compare patient satisfaction ratings between two hospitals. In order to do so, the consultant gathers ratings from 20 patients for each hospital and conducts a two-sample variance test to determine if there is a difference in the standard deviations of the patient ratings. The following steps:
- Gathered the necessary data.
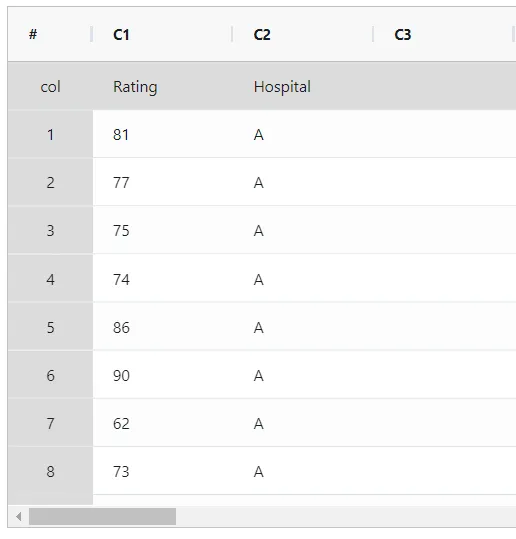
- Now analyses the data with the help of https://qtools.zometric.com/ or https://intelliqs.zometric.com/.
- To find Two variance test choose https://intelliqs.zometric.com/> Statistical module> Graphical analysis>Two variance test.
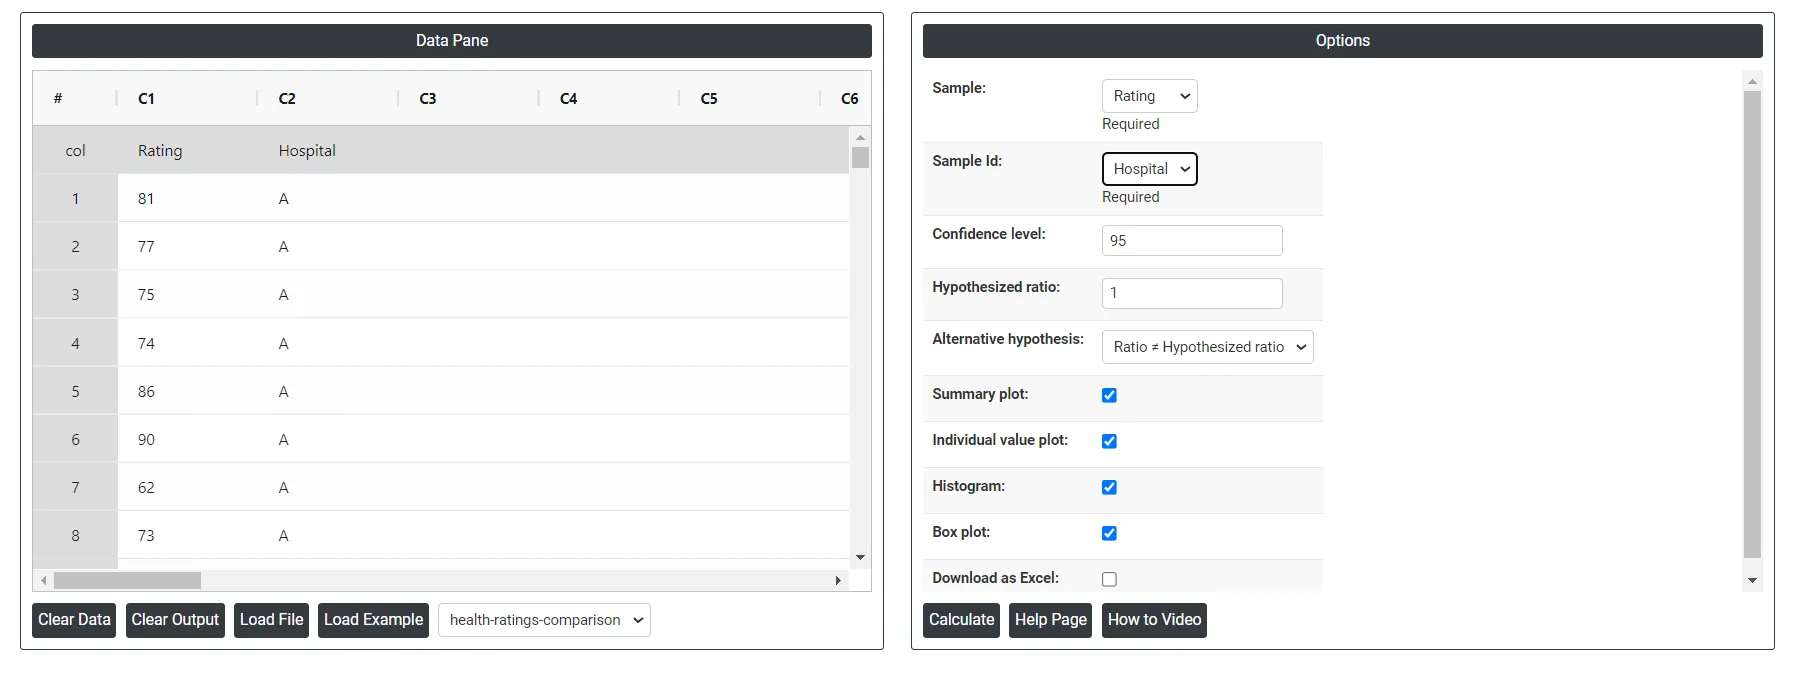
- Inside the tool, feeds the data along with other inputs as follows:
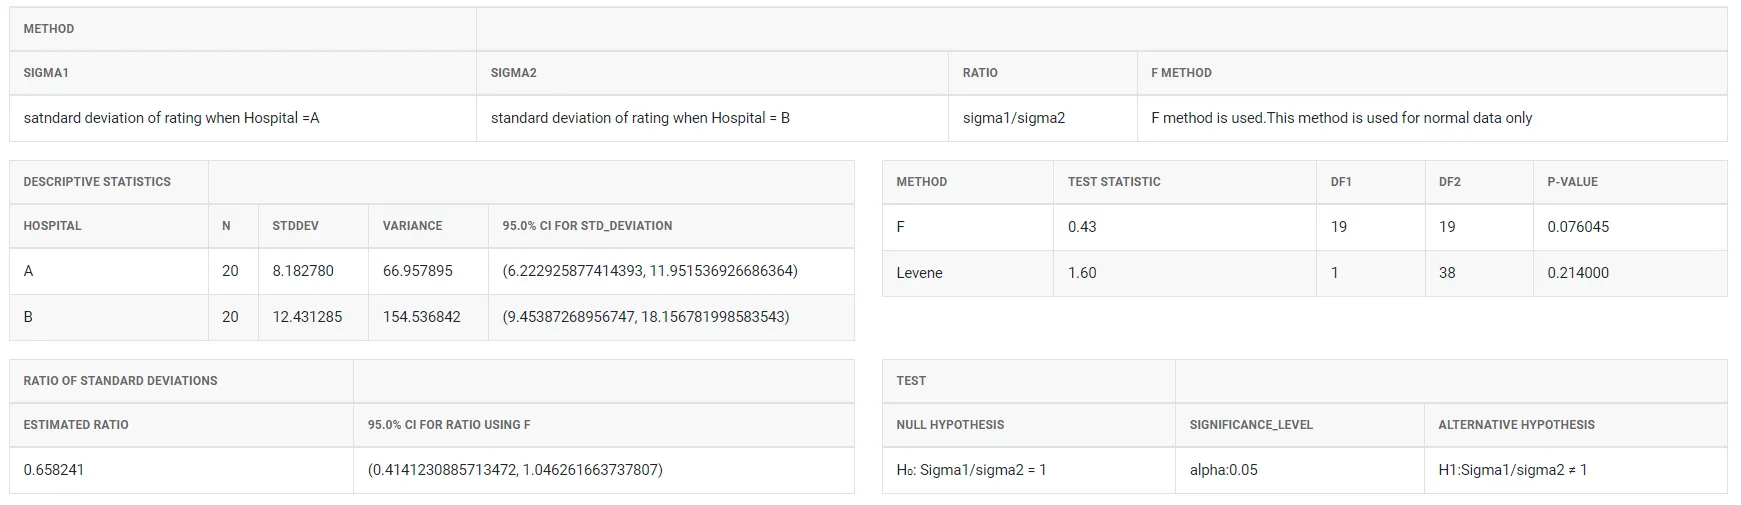
5. After using the above mentioned tool, fetches the output as follows:
How to do Two variance test
The guide is as follows:
- Login in to QTools account with the help of https://qtools.zometric.com/ or https://intelliqs.zometric.com/
- On the home page, choose Statistical Tool> Graphical analysis >Two variance test
- Click on Two variance test and reach the dashboard.
- Next, update the data manually or can completely copy (Ctrl+C) the data from excel sheet and paste (Ctrl+V) it here.
- Next, you need to put the values of confidence level and hypothesized rato.
- Finally, click on calculate at the bottom of the page and you will get desired results.
On the dashboard of Two variance test, the window is separated into two parts.
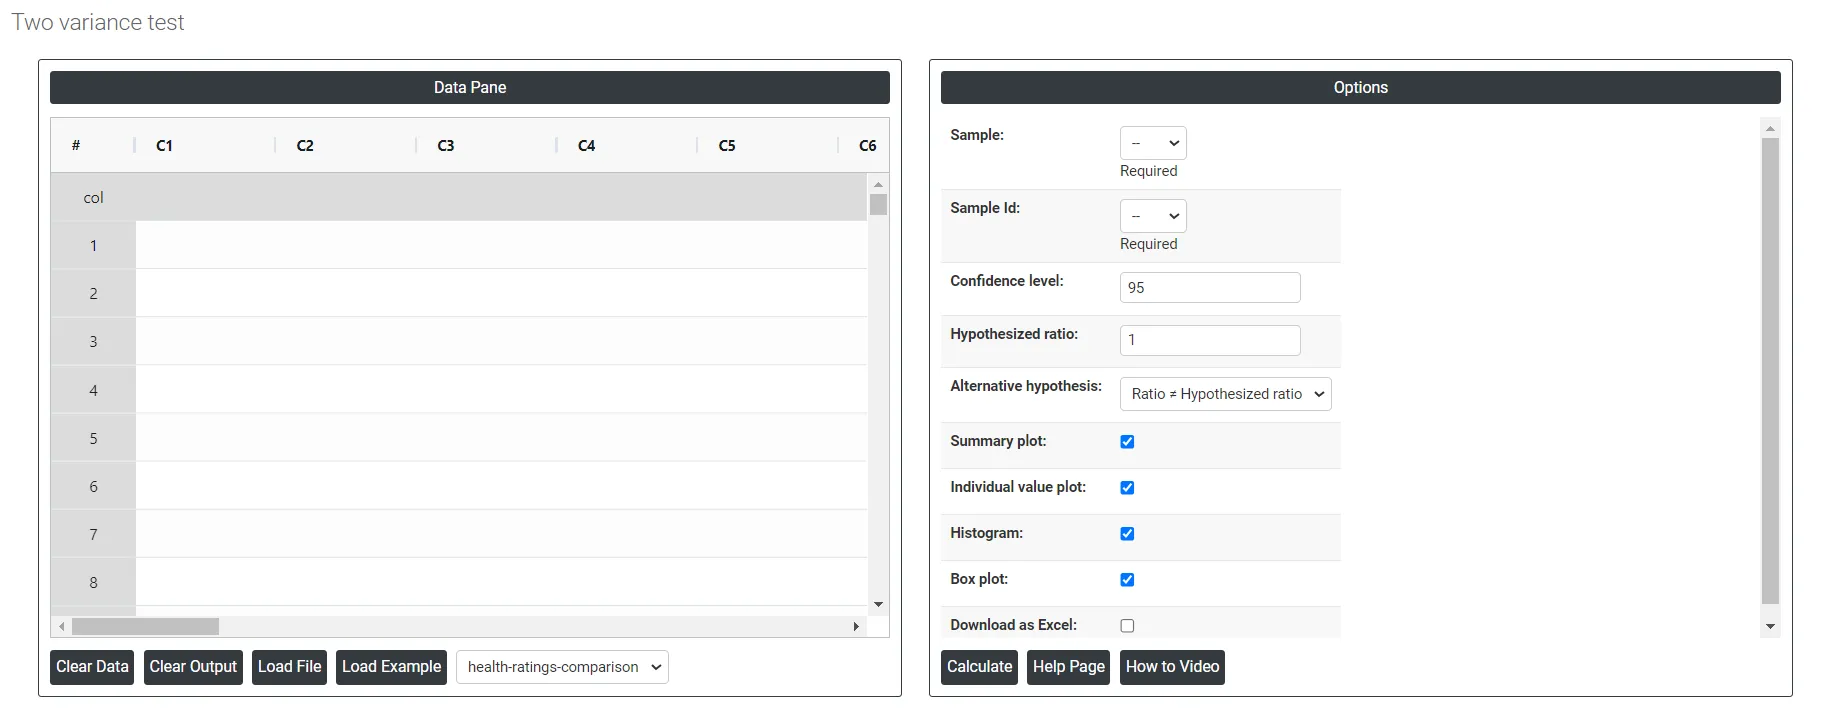
On the left part, Data Pane is present. In the Data Pane, each row makes one subgroup. Data can be fed manually or the one can completely copy (Ctrl+C) the data from excel sheet and paste (Ctrl+V) it here.
Load example: Sample data will be loaded.
Load File: It is used to directly load the excel data.
On the right part, there are many options present as follows:
- Confidence level: In hypothesis testing, the confidence level represents the degree of certainty or level of confidence that we have in our statistical analysis. It is a probability value that indicates the likelihood that the true population parameter falls within the specified range of values. Typically, the confidence level is expressed as a percentage and is denoted by (1 - α), where α is the level of significance or the probability of rejecting a true null hypothesis. For example, if we have a confidence level of 95%, then we are saying that we are 95% confident that the true population parameter lies within our interval estimate, and there is a 5% chance of making a type I error (rejecting a true null hypothesis). In practical terms, a higher confidence level means that we are more confident in our statistical analysis and results. However, increasing the confidence level also increases the width of the confidence interval, making it more difficult to detect small effects. Therefore, the choice of the confidence level depends on the context of the study and the goals of the researcher.
- Hypothesized ratio: In a two-variance test, the hypothesized ratio is the value used to test the null hypothesis that the variances of two populations are equal. It represents the expected ratio of the two population variances under the null hypothesis.
- Alternative hypothesis: In hypothesis testing, the alternative hypothesis (also called the research hypothesis) is a statement that represents a different conclusion than the null hypothesis. The null hypothesis typically represents the status quo or the assumption that there is no significant difference or relationship between two or more groups or variables. The alternative hypothesis is the statement that is being tested, and it proposes that there is a significant difference or relationship between the groups or variables being studied.
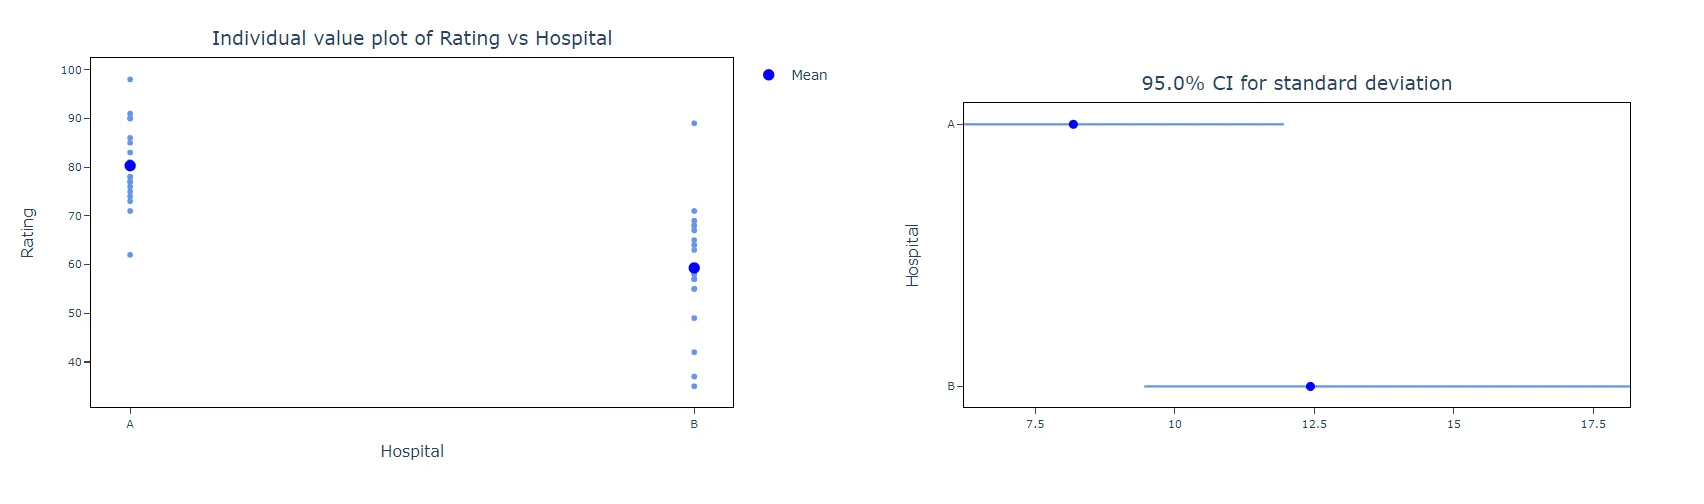
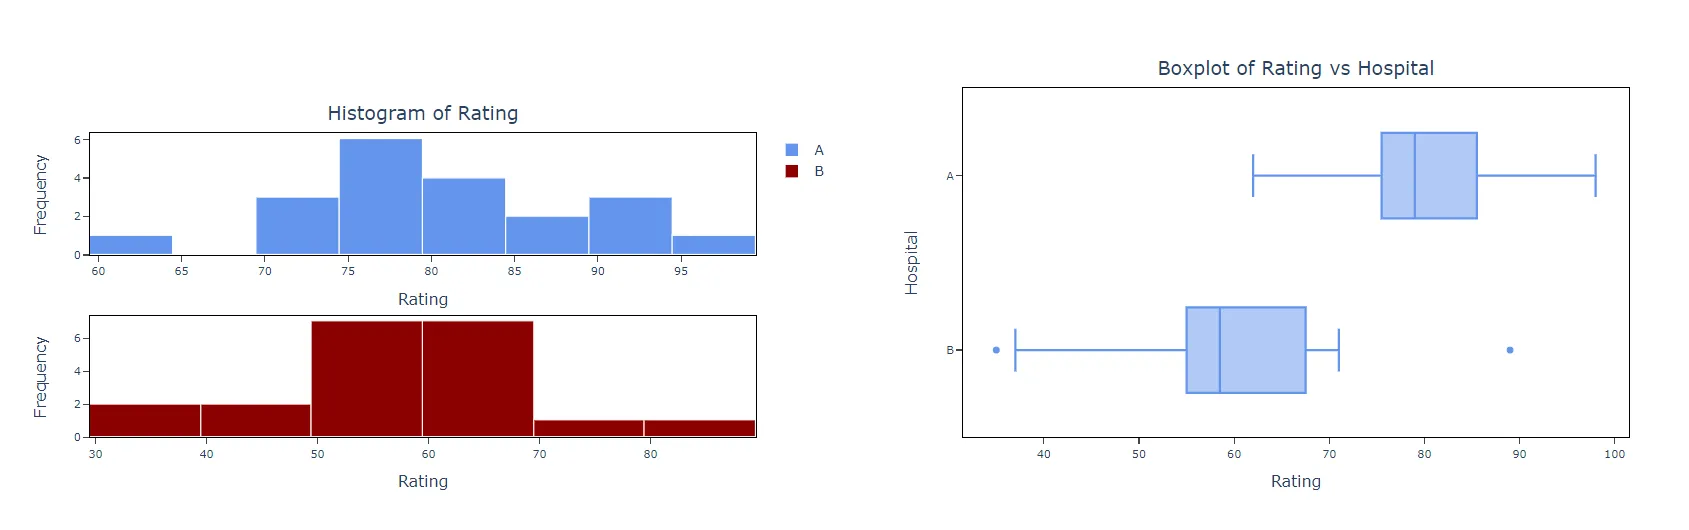
- Summary plot: A summary plot is a comprehensive visual representation used to display statistical results in a compact and informative manner. In the context of comparing the standard deviations or variances between two or more samples. By combining confidence intervals, boxplots, and statistical test results, it provides a clear and comprehensive overview of the data. In the provided graph, we see that Hospital A has less variability and more precise estimates compared to Hospital B, as indicated by the narrower confidence interval for the standard deviation. This information is crucial for identifying areas that require attention and making informed decisions based on the statistical analysis of the data.
- Individual value plot: An Individual Value Plot (IVP) is a graphical tool best suited for small sample sizes (fewer than 50 observations) that displays individual data points to facilitate detailed examination of distribution, central tendency, variability, and outliers, and is also effective for comparing distributions across multiple small groups.
- Histogram: In hypothesis testing, a histogram is a graphical representation of the distribution of a sample of data. It is a visual tool used to examine the shape and characteristics of the data. Histograms are best when the sample size is greater than 20. A histogram is created by dividing the data into a set of intervals, or bins, and counting the number of data points that fall into each bin. The bins are typically of equal width, and the height of each bar in the histogram represents the frequency of data points that fall within that bin.
- Box plot: A box plot, also known as a box-and-whisker plot, is a graphical representation of data that displays the distribution of a dataset, including its median, quartiles, and any outliers. In hypothesis testing, a box plot can be used to visually compare the distribution of a sample to a known or expected distribution, such as a normal distribution. This can help determine whether the sample data is significantly different from what is expected. The box in a box plot represents the middle 50% of the data, with the lower edge of the box indicating the first quartile (Q1), the upper edge of the box indicating the third quartile (Q3), and the line inside the box indicating the median. The whiskers extend from the box to the minimum and maximum values in the dataset, excluding any outliers, which are plotted as individual points beyond the whiskers.
- Download as Excel: This will display the result in an Excel format, which can be easily edited and reloaded for calculations using the load file. option.