
Correlation Analysis
Correlation Analysis is a statistical method that quantifies the strength and direction of the linear relationship between two or more variables. It is primarily used to examine how variables change together at a constant rate, without implying causation.
Last reviewed
Key takeaway
Correlation Analysis is a statistical method that quantifies the strength and direction of the linear relationship between two or more variables.
On this page
What is Correlation Analysis?
Correlation Analysis is a statistical method that quantifies the strength and direction of the linear relationship between two or more variables. It is primarily used to examine how variables change together at a constant rate, without implying causation. The most common measure is the Pearson correlation coefficient, which ranges from -1 (perfect negative relationship) to +1 (perfect positive relationship), with 0 indicating no linear relationship. This analysis can be applied to both quantitative and categorical variables.
When to use Correlation Analysis?
It is commonly used in various fields, including statistics, social sciences, economics, finance, and market research. Here are some situations where correlation analysis can be useful:
- Exploring relationships: Correlation analysis helps you understand the relationship between two variables. It can identify whether the variables are positively correlated (increase or decrease together), negatively correlated (one variable increases while the other decreases), or not correlated at all.
- Data screening: Correlation analysis is often used as a preliminary step to identify potential relationships before conducting more complex analyses. It can help researchers identify which variables are worth further investigation.
- Hypothesis testing: Correlation analysis can be used to test hypotheses about the relationships between variables. For example, you may want to test whether there is a significant correlation between income and education level or between customer satisfaction and purchase behavior.
- Forecasting: Correlation analysis can be used in forecasting models. If there is a strong correlation between two variables in historical data, it suggests that changes in one variable may be useful in predicting changes in the other variable.
- Variable selection: When building predictive models, correlation analysis can help in variable selection. If two variables are highly correlated, including both in the model may introduce multicollinearity issues. In such cases, you may choose to include only one of the variables or use dimensionality reduction techniques.
- Quality control: Correlation analysis can be applied in quality control processes to identify relationships between variables that may impact product quality. For example, in manufacturing, you may analyze the correlation between certain process variables and product defects.
- Portfolio management: In finance, correlation analysis is frequently used to assess the relationships between different investment assets. Understanding the correlation between assets helps in constructing diversified portfolios that can potentially reduce risk.
Guidelines for correct usage of Correlation Analysis
- Include at least 2 columns of numeric or date/time data
- All columns must have the same number of rows
- Data should be continuous or ordinal
- Perform Cross Tabulation and Chi-Square for categorical data
- Sample size should be medium to large (n ≥ 25)
- Larger samples provide more accurate and precise estimates
- Relationship between variables should be linear or monotonic
- Use matrix plot to identify and investigate outliers
- Data should follow a bivariate normal distribution
- P-value procedures for correlations are robust to departures from normality for n ≥ 25
- Confidence intervals for Pearson correlation are sensitive to normality assumption
- Confidence intervals for Spearman correlations are based on ranks and less sensitive to distribution assumption
Alternatives: When not to use Correlation Analysis
- Fit Regression Model: Fitting a regression model is typically more appropriate than conducting a correlation analysis is when you want to make predictions or estimate the values of the dependent variable based on the independent variables.
- Scatter Plot: A situation where a scatter plot may be more appropriate than correlation analysis is when there may be non-linear relationships or outliers present in the data.
Example of Correlation Analysis
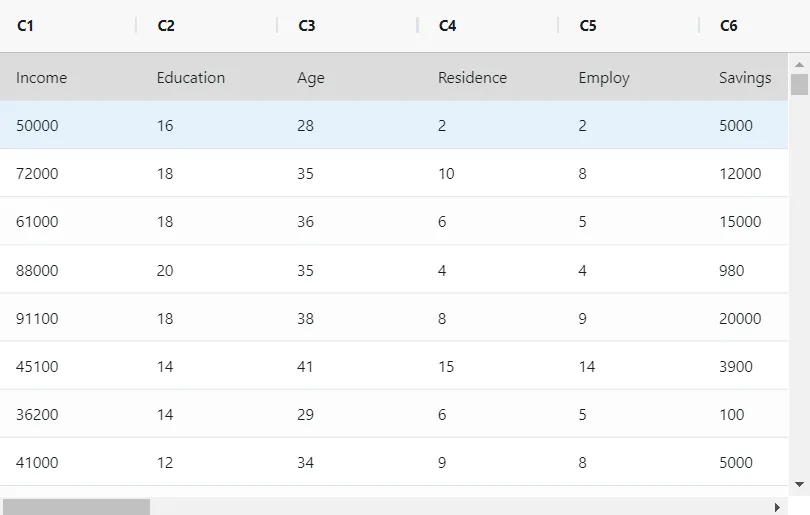
The bank mandates eight specific details from loan applicants, namely income, education level, age, length of time at current residence, length of time with current employer, savings, debt, and number of credit cards. To facilitate analysis and reporting, a bank administrator seeks to condense this information. The administrator gathers this data for 30 loan applicants. To simplify the analysis process, the administrator conducts a principal components analysis. The goal is to obtain a sufficient number of components that collectively account for 90% of the data's variability. The following steps:
- Gathered the necessary data.
- Now analyses the data with the help of https://qtools.zometric.com/ or https://intelliqs.zometric.com/.
- To find Correlation Analysis choose https://intelliqs.zometric.com/> Statistical module> Graphical analysis> correlation analysis.
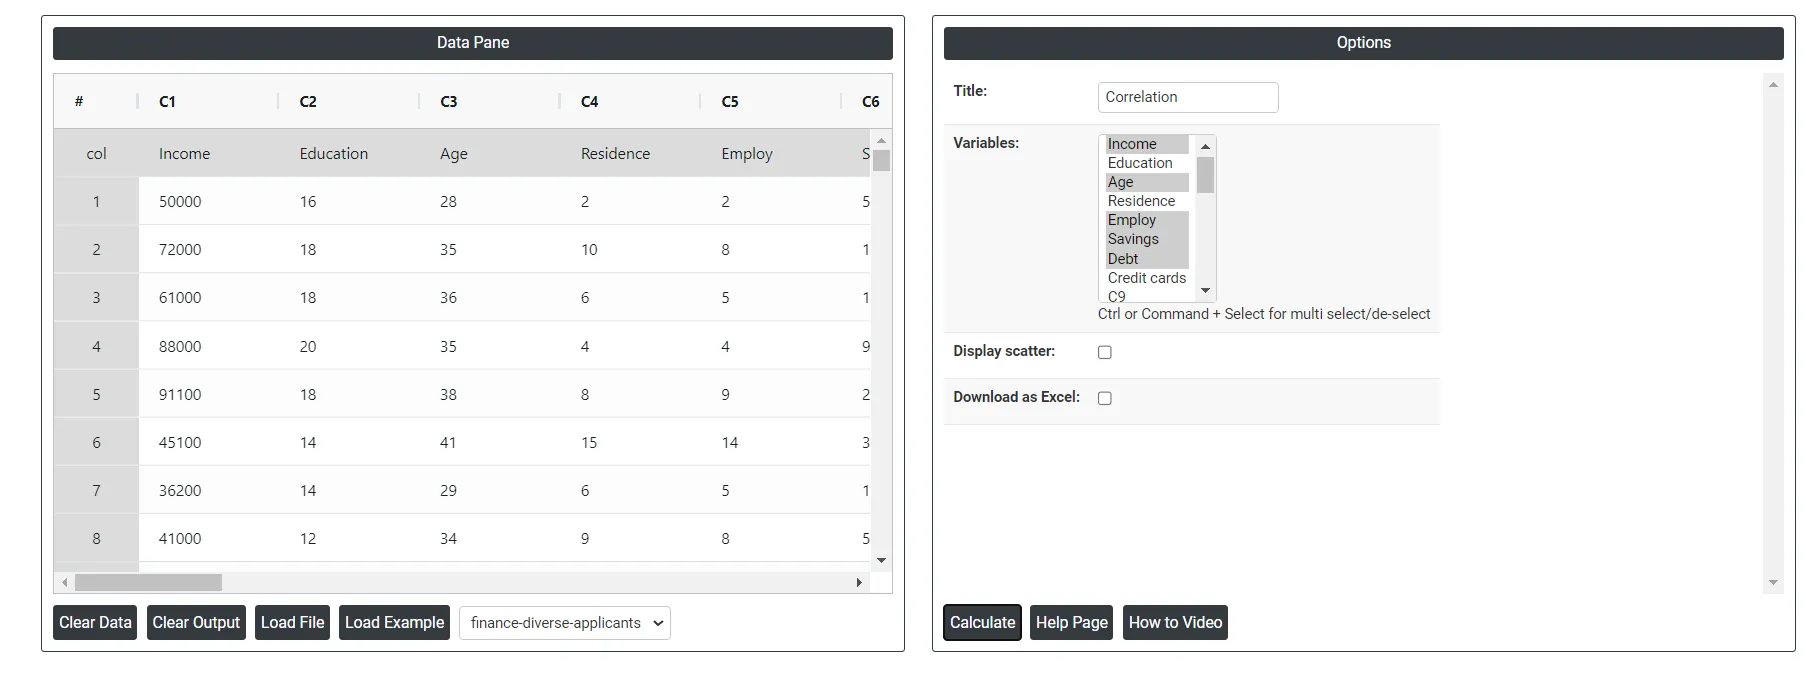
- Inside the tool, feed the data along with other inputs as follows:
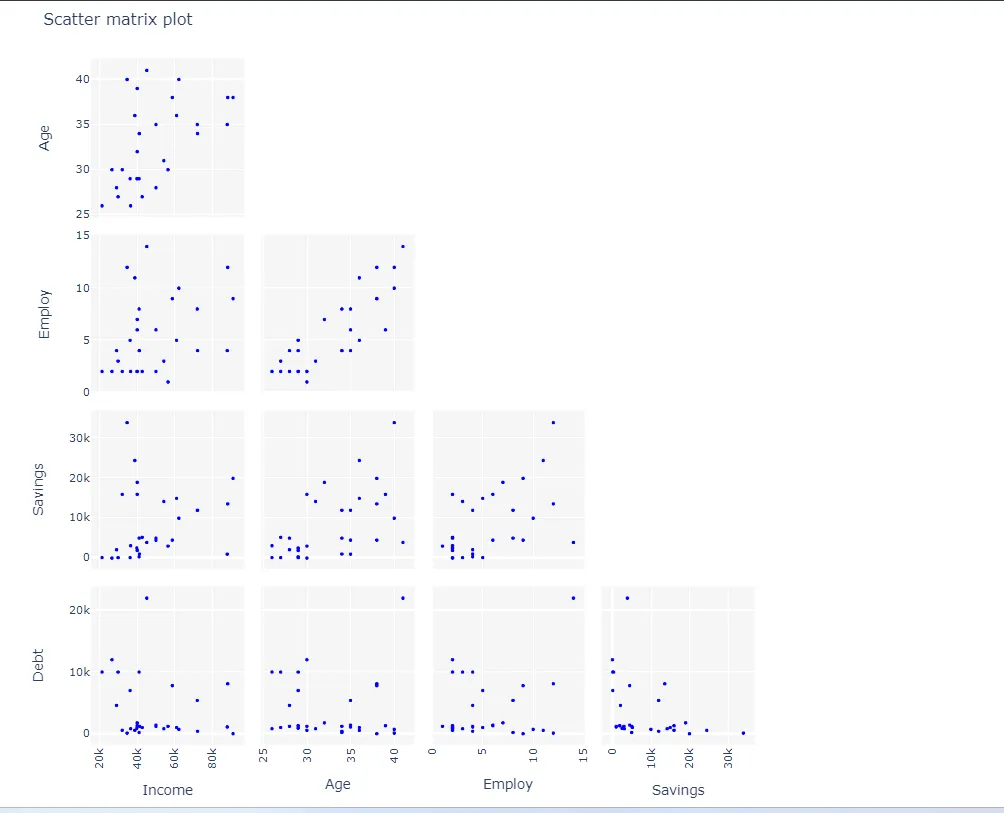
5. After using the above-mentioned tool, fetches the output as follows:
How to do Correlation Analysis
The guide is as follows:
- Login in to QTools account with the help of https://qtools.zometric.com/ or https://intelliqs.zometric.com/
- On the home page, choose Statistical Tool> Graphical analysis > correlation analysis.
- Next, update the data manually or can completely copy (Ctrl+C) the data from excel sheet or paste (Ctrl+V) it or else there is say option Load Example where the example data will be loaded.
- Next, you need to map the columns with the parameters.
- Finally, click on calculate at the bottom of the page and you will get desired results.
On the dashboard of Correlation Analysis, the window is separated into two parts.
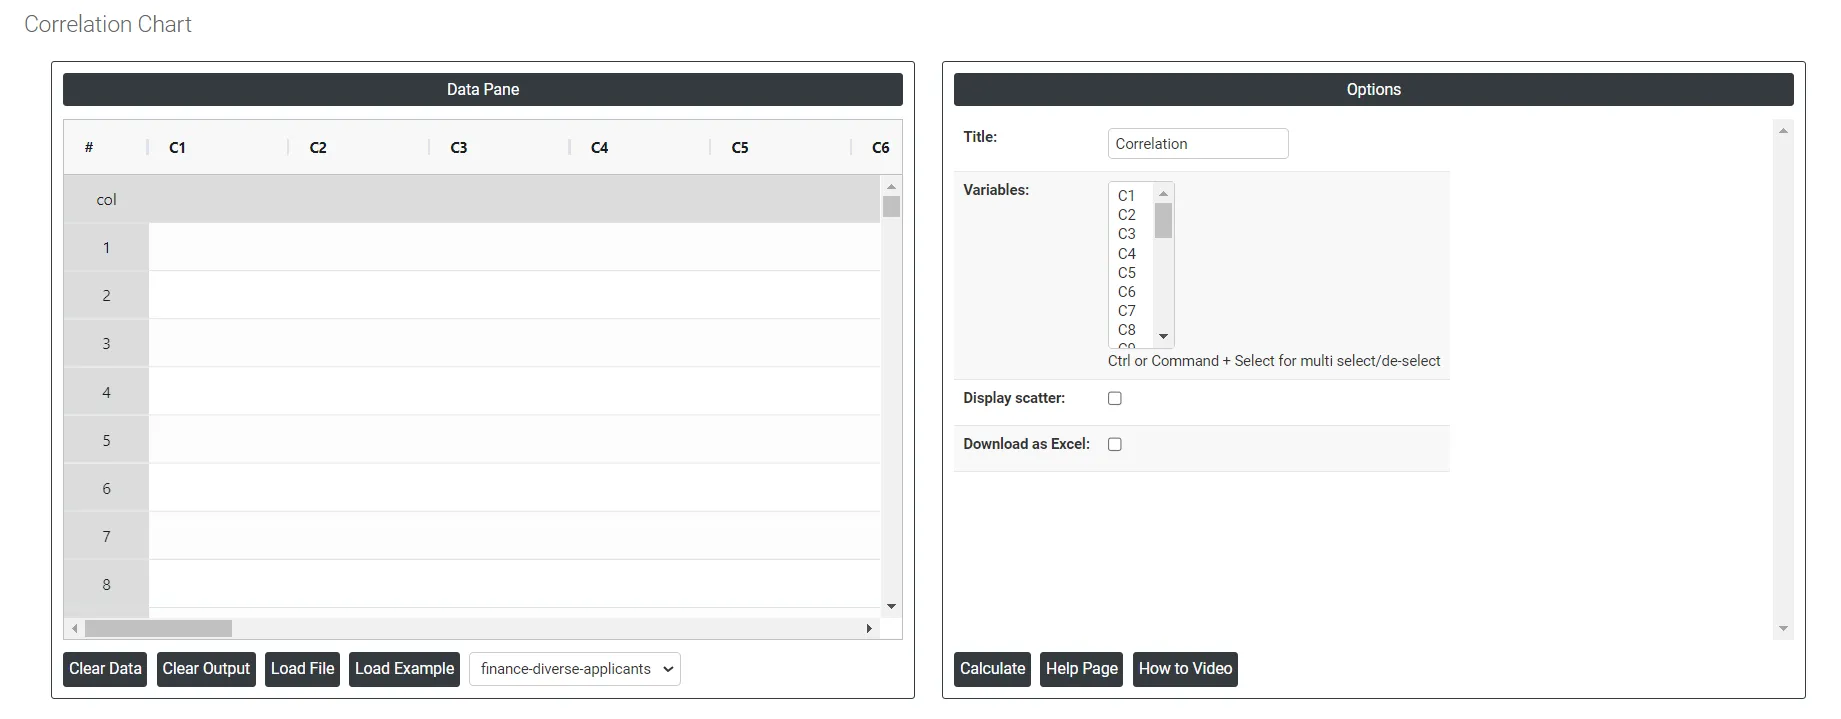
On the left part, Data Pane is present. In the Data Pane, each row makes one subgroup. Data can be fed manually or the one can completely copy (Ctrl+C) the data from excel sheet and paste (Ctrl+V) it here.
Load example: Sample data will be loaded.
Load File: It is used to directly load the excel data.
On the right part, we just need to give:
Variables: To select multiple variables for correlation analysis, first identify the quantitative variables of interest in your dataset. Then, calculate the pairwise correlation coefficients between these variables to understand the strength and direction of their linear relationships. This process helps in determining which variables are strongly related, aiding in feature selection and multivariate analysis for further research or modelling.
Display Scatter: Displaying a scatter plot in correlation analysis visually represents the relationship between two variables, showing their association on a Cartesian plane. It helps identify patterns, trends, and outliers, complementing the numerical correlation coefficient. This visualization provides a clearer understanding of the strength and direction of the linear relationship between the variables.
Download as Excel: This will display the result in an Excel format, which can be easily edited and reloaded for calculations using the load file option.