
A Beginner's Guide to Design of Experiments (DOE) in Zometric
Tired of changing one setting at a time and hoping for the best? This beginner's guide walks through Design of Experiments (DOE) in Zometric — from planning your first factor study to modelling curvature, checking your assumptions, and letting the software find your optimal settings for you.
On this page
- Why not just change one thing at a time?
- The vocabulary you need
- Zometric's DOE toolkit
- Walkthrough: Optimizing a process with RSM
- Step 1: Define your factors
- Step 2: Zometric builds the design matrix
- Step 3: Let Zometric fit the model
- Step 4: Read the coefficients table
- Step 5: Check whether the model is significant — ANOVA
- Step 6: Check your assumptions — residual plots
- Step 7: Visualize the response surface
- Step 8: Let Zometric find the optimum for you
- When robustness matters more than optimization: Taguchi
- A few practical tips for beginners
- Where to go next
If you've ever tweaked one setting at a time on a machine, a recipe, or a chemical process — changing the temperature, running a test, then changing the pressure, running another test — you've done experimentation. Design of Experiments (DOE) is simply a smarter, more efficient way to do that same exploration, so you learn more from fewer runs and actually understand how your factors interact with each other.
This guide walks through the basics of DOE and shows you, step by step, how to run a real experiment using Zometric's DOE tools.
Why not just change one thing at a time?
Changing one factor at a time (OFAT) feels intuitive, but it has two big problems:
- It misses interactions. Maybe temperature only matters when pressure is high. OFAT testing can't see that — you'd need to test every combination to find it.
- It wastes runs. DOE uses a carefully planned set of combinations so every run teaches you something about every factor, instead of holding everything else “constant” and hoping that's representative.
DOE gives you a structured plan — a design matrix — that spreads your test runs across combinations of factors so you can separate out what's really driving your results.
The vocabulary you need
A handful of terms come up in every DOE tool:
- Factor — something you control and change (e.g. Temperature, Pressure, Time).
- Level — the specific values a factor is tested at (e.g. Temperature at 150 and 180).
- Response — the outcome you're measuring (e.g. Yield, Strength, Defect Rate).
- Run — one experiment: one specific combination of factor levels.
- Center point / replicate — repeated runs at the midpoint of your ranges, used to check for curvature and estimate experimental noise.
- Main effect — how much the response changes when a factor moves from low to high, on its own.
- Interaction — when the effect of one factor depends on the level of another.
- Curvature — when the relationship between a factor and the response isn't a straight line (this is where Response Surface designs come in).
Zometric's DOE toolkit
Zometric includes a full family of DOE tools, and which one you reach for depends on where you are in your investigation:
- Factorial / Screening Designs — early-stage tools for narrowing down a long list of candidate factors to the few that actually matter.
- Response Surface Methodology (RSM) — for modeling curvature and finding the factor settings that optimize a response. This is the main walkthrough below.
- Taguchi Robust Design — for finding settings that keep your response stable even when uncontrollable “noise” factors vary.
- Mixture Designs — for formulations, where factors are ingredient proportions that must add up to 100%.
The rest of this guide walks through a full example using RSM, then shows how Taguchi fits in when robustness matters more than raw optimization.
Walkthrough: Optimizing a process with RSM
Let's say we're optimizing the Yield of a chemical reaction, and we believe Temperature and Pressure are the two factors that matter most.
Step 1: Define your factors
In the RSM tool, you list each factor and the low/high range you want to explore. Zometric handles the rest of the design construction for you — you don't need to know the underlying math to get started.

Step 1 factor entry table showing Temperature (150–180) and Pressure (10–20)
Step 2: Zometric builds the design matrix
Once you click “Generate Design,” Zometric creates a run order for you automatically. Notice the different Point Types:
- factorial points — the corners of your factor ranges (the classic 2-level combinations).
- center points — repeated runs at the midpoint, used to check whether the relationship is curved.
- axial points — points extended slightly beyond your range, which is what lets RSM model curvature (this is what makes it a Central Composite Design, or CCD).
You simply run each of these combinations in your lab or process and type the result into the Result column.
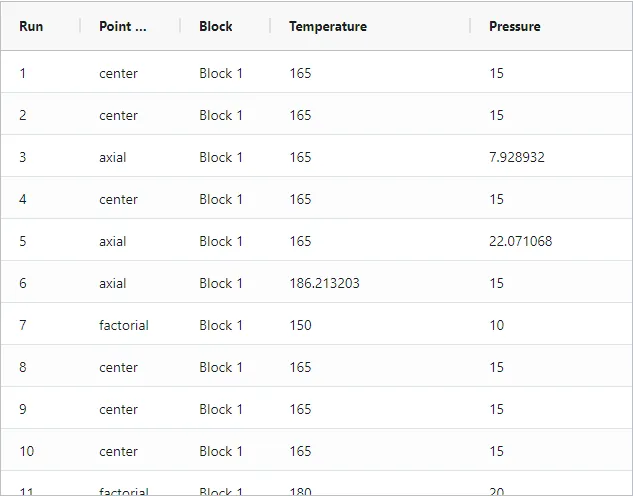
The generated design matrix grid, showing Run, Point Type, Block, Temperature, Pressure columns
Step 3: Let Zometric fit the model
Once your results are entered, click “Analyse Design.” Zometric fits a regression model and gives you back a plain-language equation:

The “Response: Yield” header and regression equation line
Each term in parentheses is (coefficient * factor). A positive coefficient means increasing that factor increases Yield; a negative one (like the squared terms here) means there's a “sweet spot” — Yield goes up and then comes back down, which is the curvature we mentioned earlier.
Step 4: Read the coefficients table
The coefficients table breaks the equation down term by term, showing the size of each effect and whether it's statistically significant (a P Value under 0.05 is the usual cutoff).
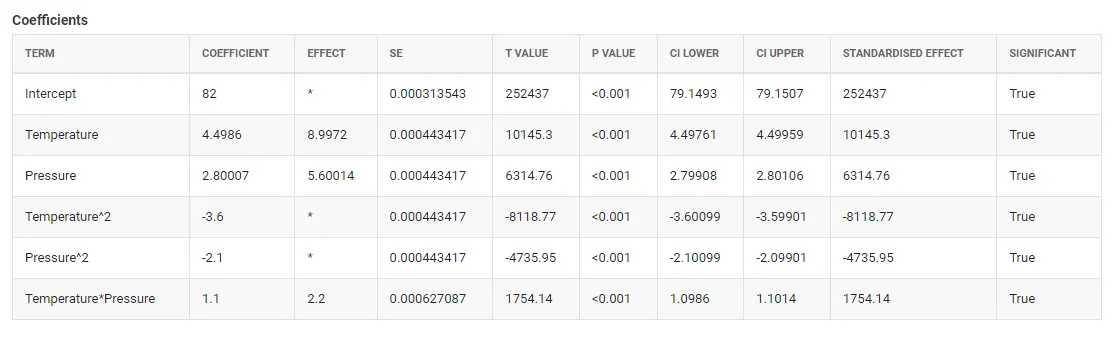
The Coefficients table
A * in a column (like the “Effect” column for the Intercept or a squared term) simply means that particular statistic doesn't apply to that row — not every metric makes sense for every term.
Step 5: Check whether the model is significant — ANOVA
The Analysis of Variance (ANOVA) table answers a bigger-picture question: is your model, as a whole, actually explaining the variation in your data, or could these patterns just be noise? Look at the Regression row's P Value — if it's small (typically under 0.05), your model is statistically meaningful.
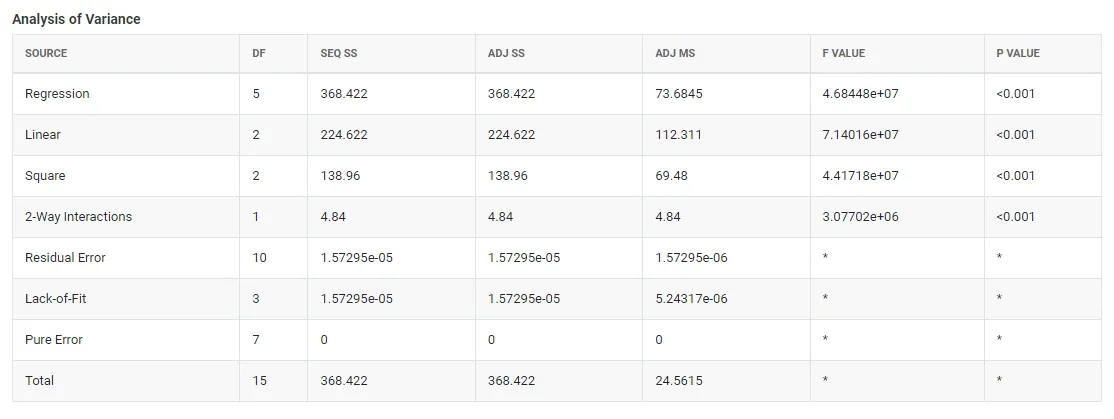
The Analysis of Variance table
Step 6: Check your assumptions — residual plots
Before trusting any model, it's worth glancing at the residual plots. These check whether the “leftover” error in your predictions behaves the way it should — random, and not hiding any pattern:
- Normal Probability Plot — residuals should roughly follow the straight red line.
- Versus Fits — residuals should be scattered evenly, with no funnel or curve shape.
- Histogram — should look roughly bell-shaped.
- Versus Order — checks that there's no drift or trend over the order you ran your experiments.
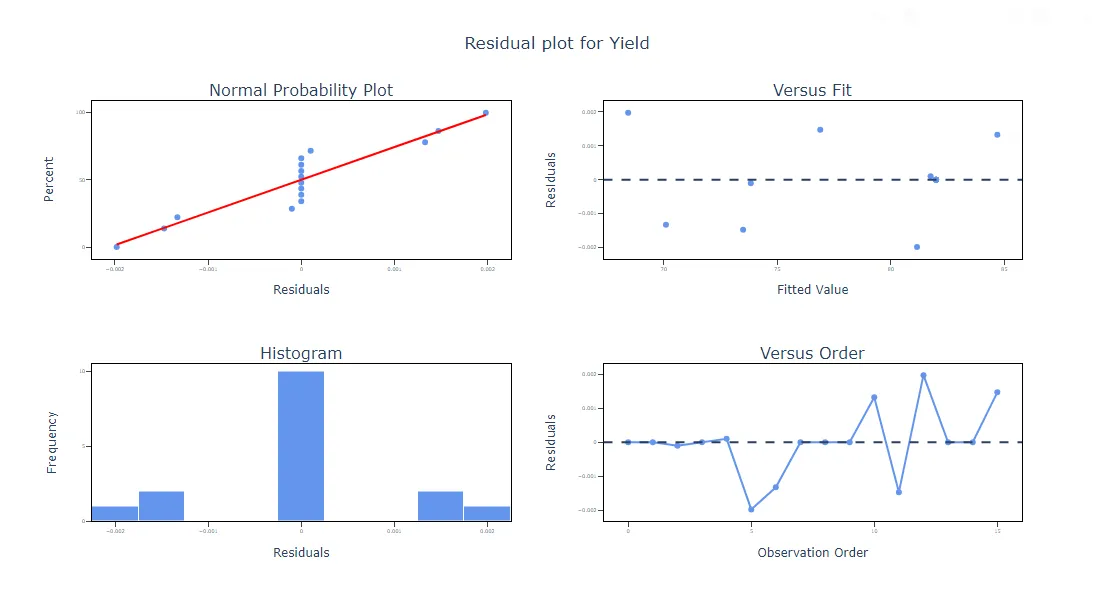
The four-in-one residual plot panel
Step 7: Visualize the response surface
This is where RSM really shines over a simple factorial design: a contour plot shows you the shape of the response across your entire factor space, not just at the corners.
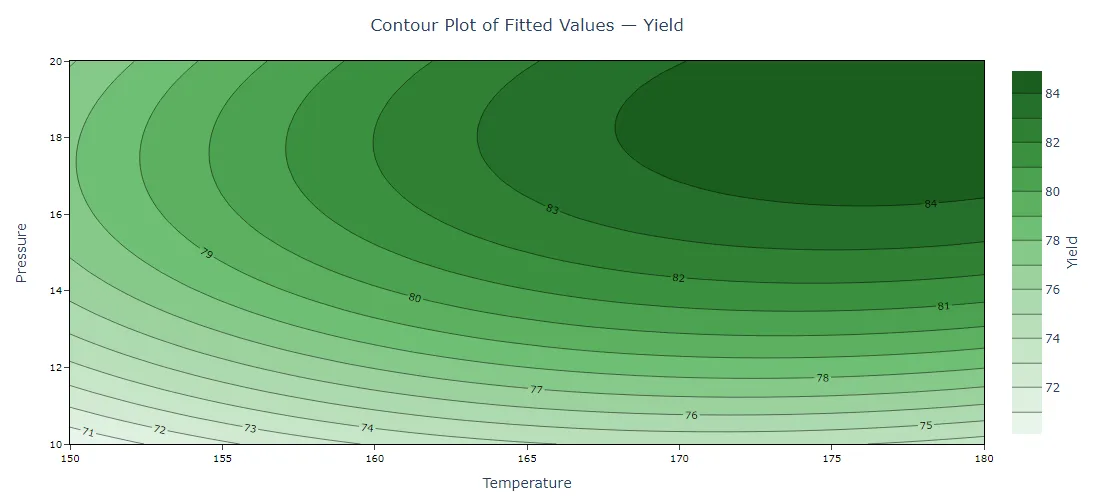
The contour plot of Yield vs Temperature and Pressure
Here, the darkest green region in the upper-right is where Yield is highest — around Temperature 175–180 and Pressure 18–20. You can see the “sweet spot” the curvature in our equation predicted.
Step 8: Let Zometric find the optimum for you
Rather than eyeballing the contour plot, Zometric's built-in Response Optimizer (Step 3 in the RSM tool) solves for the best factor settings automatically. You just tell it your goal for each response (maximize, minimize, or hit a target), and it searches the fitted model for you.
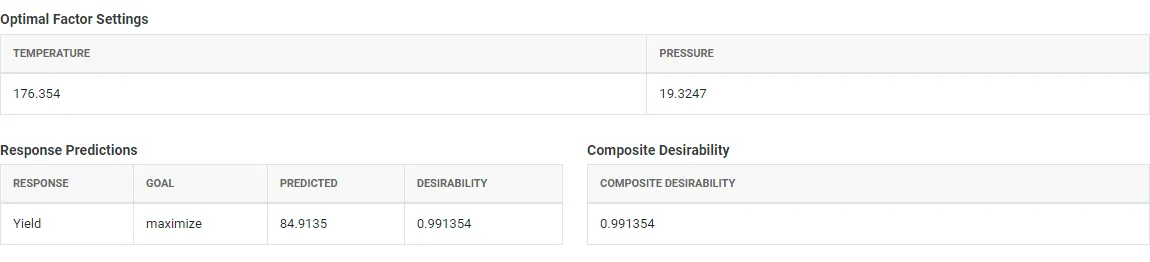
The Optimal Factor Settings, Response Predictions, and Composite Desirability tables
The Desirability score (0 to 1) tells you how close the optimizer got to your ideal outcome — closer to 1 is better.
When robustness matters more than optimization: Taguchi
RSM finds the best settings assuming everything else stays constant. But in the real world, some factors — humidity, raw material batches, ambient temperature — are outside your control. That's where Taguchi Robust Design comes in: instead of only asking “what's the best setting?”, it asks “what setting keeps my process performing well even when uncontrollable noise varies?”
The output includes a Main Effects Plot, which shows at a glance which factor level pushes your response in which direction:
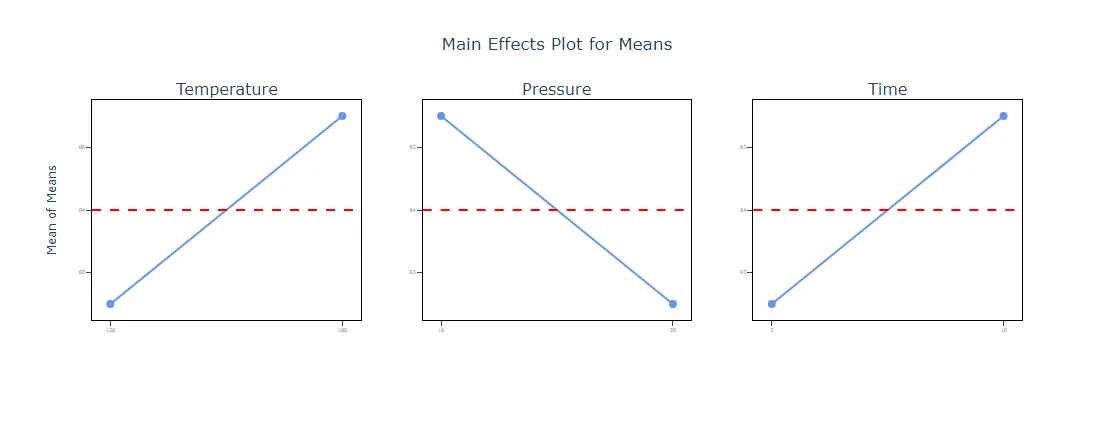
Main Effects Plot for Means, showing Temperature, Pressure, and Time
A steep line means that factor has a strong effect on the response; a flatter line means it matters less. Taguchi also computes a Signal-to-Noise ratio for each run, which is the metric it actually optimizes — it rewards settings that are both good and consistent.
Other tools worth knowing about
- Factorial / Screening Designs are a good starting point if you have many candidate factors and aren't sure yet which ones matter — they use far fewer runs than a full RSM study and are perfect for narrowing your list down before you invest in a deeper study.
- Mixture Designs are for formulation problems, where your factors are ingredient percentages that must always add up to 100% (e.g. developing a coating, a blend, or a recipe).
A few practical tips for beginners
- Always include center points or replicates. They're your only way to estimate experimental noise and detect curvature.
- Don't extrapolate. A model fit between 150–180°C tells you nothing reliable about 200°C — stay inside the range you tested.
- Check the residual plots before trusting the model. A great-looking R-squared can still hide a bad model if the residuals show a pattern.
- Start narrow, then expand. If you have more than 4–5 candidate factors, screen first, then bring only the important ones into an RSM or Taguchi study.
- Let the software do the design math. The value of DOE tools like Zometric isn't just the analysis — it's making sure your experiment is planned efficiently in the first place.
Where to go next
Zometric's DOE suite covers the full journey — screening, optimization, robustness, and formulation — all from the same workspace. The best way to get comfortable is to run a small, real experiment of your own: pick two or three factors you already suspect matter, and let Zometric build the design for you. (learn more)