
Bioassay — Cylinder-Plate 5+1 Assay
On this page
What is Bioassay — Cylinder-Plate 5+1 Assay?
The Cylinder-Plate 5+1 Assay is a microbiological potency assay for antibiotics, based on the diffusion of antibiotic from agar-plate cylinders into an inoculated agar layer, producing a measurable zone of growth inhibition around each cylinder. It implements the 2010 revision of USP General Chapter <81> “Antibiotics — Microbial Assays,” using five (or more) standard concentrations plus a single matched dilution of the test/unknown material.
The design places the median (“S3”, reference) standard concentration in the odd-numbered wells of every plate, while each of the other four standard concentrations — and each Sample/Unknown — occupies the even-numbered wells of its own dedicated set of three plates. Because every set of three plates carries its own reference-well readings, a plate-to-plate correction can be applied before fitting a single standard curve: each set’s mean is corrected using X_C = X_S − (X_R − P), where X_S is that set’s own test-well mean, X_R is that set’s own reference-well mean, and P (the “correction point”) is the average reference-well mean across the standard sets.
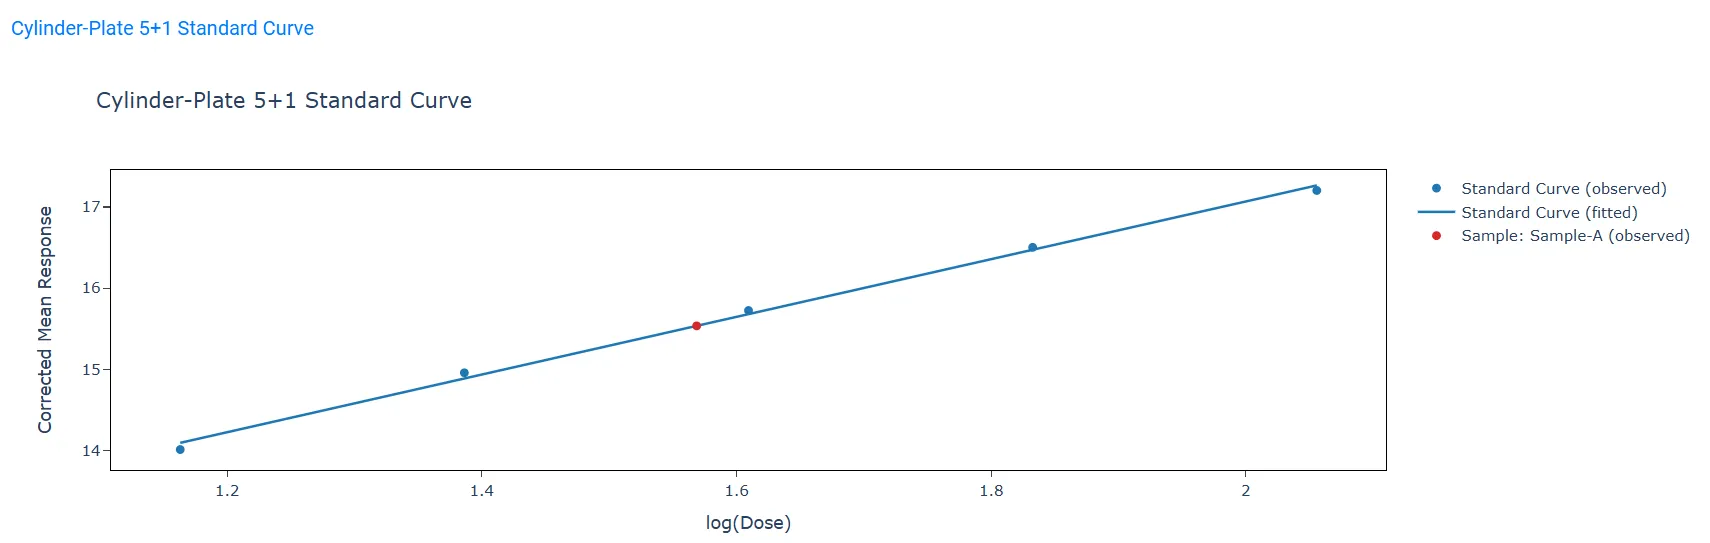
The five corrected points (S1, S2, the S3 reference itself, S4, S5) are then fit with a single unweighted linear regression against log(dose), and the sample’s corrected mean is interpolated off that same line to obtain its relative potency — no parallelism test is required, since the assay design uses only one dose level of the sample. Validity is checked via a %RSD variability-suitability limit on every set and a minimum R² for the standard curve fit; a computed potency outside 80–125% flags the run as “preliminary” (i.e., the sample’s assumed potency should be adjusted and the assay repeated).
Because a single 5+1 run reports no confidence interval on its own (per USP <81>), the tool also supports combining two or more independent assay runs: it computes a t-distribution confidence interval on the mean log relative potency across runs, with an Appendix 2 “gap test” (distinct from Dixon’s Q) available to flag a single outlying run once three or more runs are supplied.
When to use Bioassay — Cylinder-Plate 5+1 Assay?
Use the Cylinder-Plate 5+1 Assay when potency must be estimated from a classic agar-diffusion (zone of inhibition) antibiotic assay, following the specific 5+1 plate design of USP <81> — five (or more) standard concentrations with the median concentration repeated as a reference in every plate, and a single matched dilution of the sample/unknown.
Guidelines for correct usage of Bioassay — Cylinder-Plate 5+1 Assay
- Always place the Standard preparation at the reference (median, S3) dose in the reference wells of every plate — including the sample's own plates — exactly as the design requires.
- Dedicate each physical plate to exactly one non-reference concentration: either one of the other four standard levels, or a single test level of one Sample/Unknown.
- Provide at least 4 non-reference standard concentrations (S1, S2, S4, S5) in addition to the S3 reference dose — this is the minimum for the 5+1 design.
- Dilute the sample so its nominal concentration matches the reference (S3) dose — this keeps the interpolation within the linear portion of the standard curve.
- Check the %RSD variability-suitability result and the standard curve R² before trusting a potency result — both are pass/fail validity checks, not just descriptive statistics.
- If the computed relative potency falls outside 80–125%, treat the result as preliminary: adjust the assumed sample potency and repeat the assay rather than reporting it directly.
- Combine 3 or more independent assay runs (via the Assay run column) whenever a reportable confidence interval is required — a single run does not produce one.
Alternatives: When not to use Bioassay — Cylinder-Plate 5+1 Assay
If the assay does not follow the specific 5+1 plate layout (e.g. a linear-regression assay with multiple dose levels of both standard and test on the log-dose scale), use the Bioassay — Parallel Line Method instead. If the response is linear in dose itself (not log-dose), use the Slope Ratio Method. If the response is binary/quantal (e.g. survival vs. death), use the Quantal Response Method. If several independent assay results (of any bioassay type) already exist as summary potency/CI rows and only need to be pooled, use Bioassay — Combine Assays directly.
Example of Bioassay — Cylinder-Plate 5+1 Assay?
A quality-control analyst runs a cylinder-plate assay for an antibiotic, using five standard concentrations (S1–S5, with S3 = 5.00 U/mL as the reference) and a single matched dilution of a test lot (“Sample-A”), with three replicate plates per concentration. The analyst follows these steps:
- Gathered the necessary data.
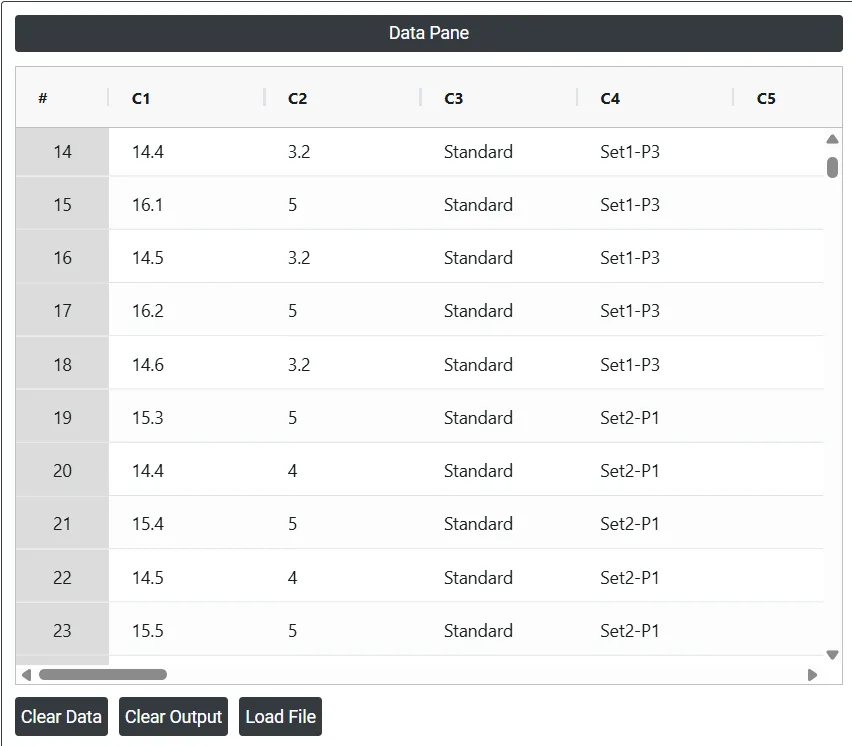
- Now analyses the data with the help of https://statsai.zometric.com/.
- To find Bioassay — Cylinder-Plate 5+1 Assay, choose intelliqs.zometric.com > Statistical module > Regression > Bioassay — Cylinder-Plate 5+1 Assay.
- Inside the tool, feeds the data along with other inputs as follows:
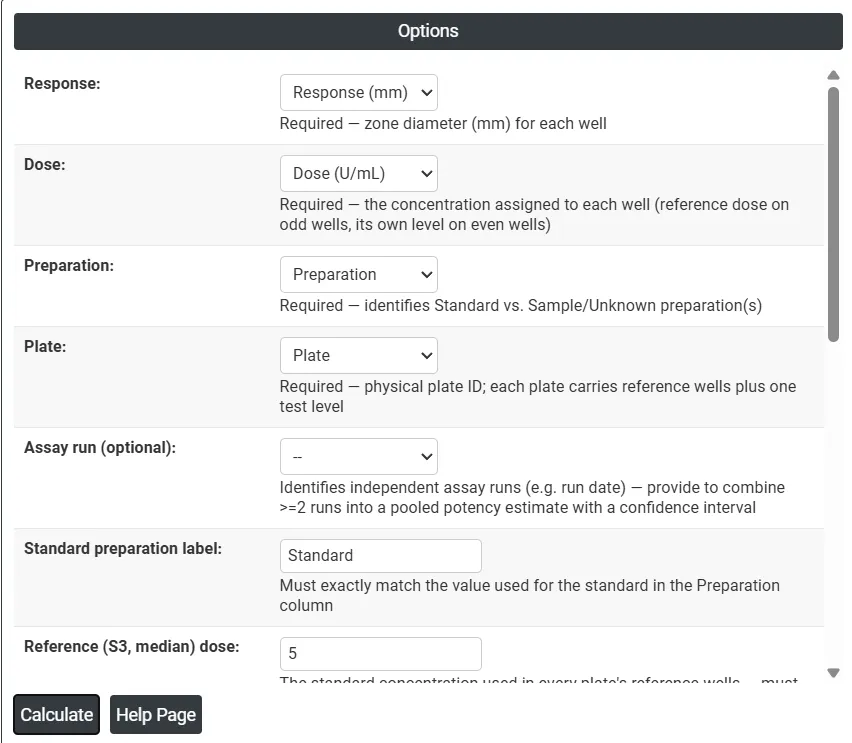
- After using the above mentioned tool, fetches the output as follows:
How to generate Bioassay — Cylinder-Plate 5+1 Assay?
The guide is as follows:
- Login in to Stats AI account with the help of https://statsai.zometric.com/
- On the home page, choose Statistical Tool > Regression > Bioassay — Cylinder-Plate 5+1 Assay.
- Click on Bioassay — Cylinder-Plate 5+1 Assay and will reach the dashboard.
- Next, update the data manually or can completely copy (Ctrl+C) the data from excel sheet and paste (Ctrl+V) it here.
- Next, you need to select the Response, Dose, Preparation, and Plate columns, enter the Standard preparation label, and enter the Reference (S3, median) dose.
- Finally, click on calculate at the bottom of the page and you will get desired results.
On the dashboard of Bioassay — Cylinder-Plate 5+1 Assay, the window is separated into two parts.
On the left part, Data Pane is present. Data can be fed manually or the one can completely copy (Ctrl+C) the data from excel sheet and paste (Ctrl+V) it here.
- Load example: Sample data will be loaded.
- Load File: It is used to directly load the excel data.
On the right part, there are many options present as follows:
- Response: The column containing the measured zone-of-inhibition diameter (mm) for each well.
- Dose: The column containing the concentration assigned to each well — the reference (S3) dose on odd wells, and each set's own concentration on even wells. Values must be strictly positive.
- Preparation: The column identifying whether each well is the Standard preparation or a Sample/Unknown.
- Plate: The column identifying which physical plate each well belongs to — each plate must carry reference wells plus exactly one test level.
- Assay run (optional): The column identifying independent assay runs (e.g. run date). Provide this to combine 2 or more runs into a pooled relative potency with a confidence interval and an outlier check (once 3+ runs are supplied).
- Sample replicate set (optional): Identifies independent replicate plate sets for the same sample within one assay (e.g. "Set-1"/"Set-2"/"Set-3") — provide to average them with a %RSD suitability check. (learn more)
- Standard preparation label: The exact text used in the Preparation column to identify the standard (e.g., "Standard").
- Reference (S3, median) dose: The standard concentration used in every plate's reference wells — must exactly match a value in the Dose column.
- Nominal/label reference concentration (optional): If the standard's actual prepared concentration above differs slightly from its nominal 100% target (e.g. due to a reference-standard potency correction), enter the nominal value here — %Assay is reported against it instead. Defaults to the reference dose above. (learn more)
- Assumed sample potency: The nominal (labelled) potency of the sample/unknown preparation(s), used to convert relative potency into an absolute estimated potency. Per-preparation overrides can be entered for multiple samples.
- Logarithm base: Natural log (ln) or log base 10 — used for the standard curve regression against log(dose).
- Confidence level: The confidence level (%) used for the combined-run confidence interval.
- Compliance lower limit / Compliance upper limit: The acceptable range (%) for the estimated relative potency — USP suggests 80–125% — used to flag a result as Pass or Preliminary.
- Variability suitability limit (%RSD): The maximum acceptable relative standard deviation for any reference- or test-well set — USP-suggested limit: NMT 10%.
- Standard curve fit limit (R-Squared %): The minimum acceptable coefficient of determination for the standard curve regression — USP-suggested limit: NLT 95%.
- Significance level for combined-run confidence interval (α): The significance threshold used when combining ≥ 2 independent assay runs.
- Show standard curve graph: Toggle to include or exclude the standard curve plot from the output.
- Download as Excel: This will display the result in an Excel format, which can be easily edited and reloaded for calculations using the load file option.