
Bioassay - Parallel Line Method
On this page
What is Bioassay — Parallel Line Method?
A parallel line assay, also known as the Parallel Line Method, is a statistical procedure used to estimate the relative potency of a test preparation compared to a standard preparation in a biological assay. It compares the dose-response relationship of the standard and test preparation(s) on a common log(dose) scale, under the assumption that a valid comparison requires the fitted lines to run parallel to one another.
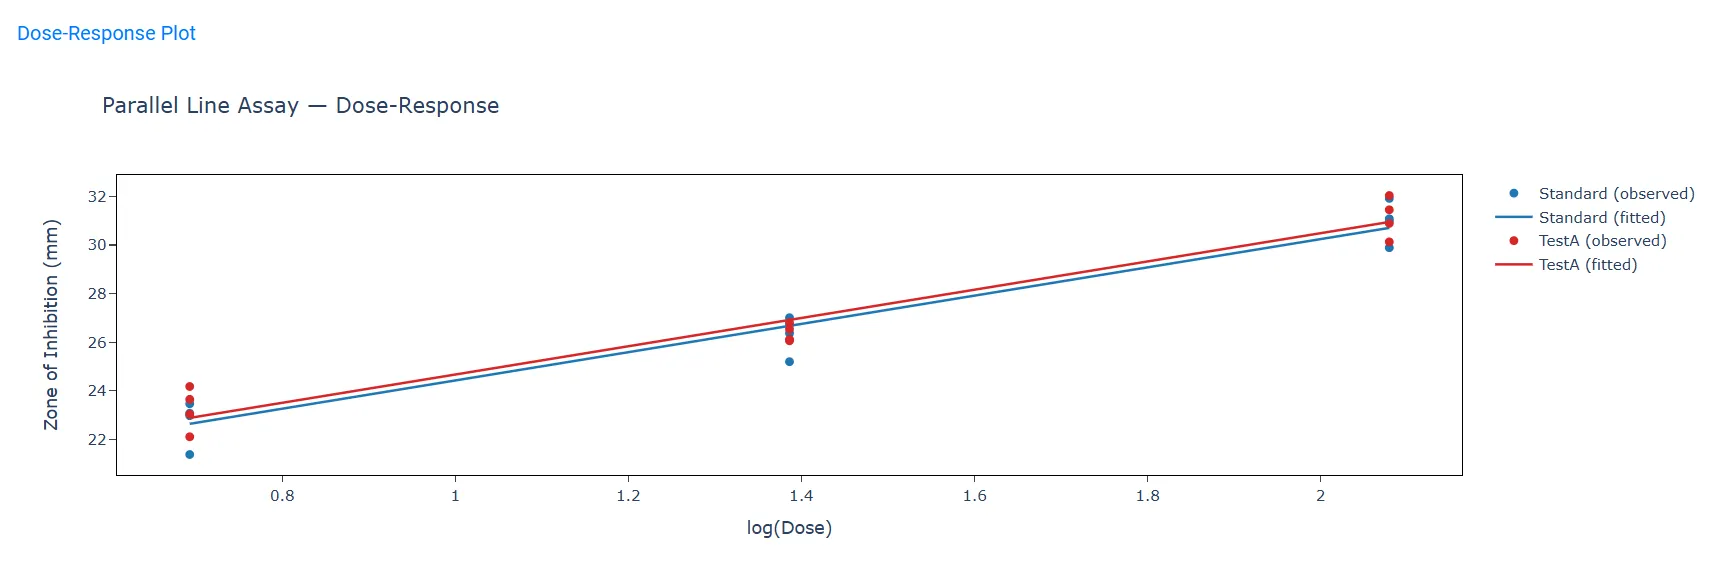
In a parallel line assay, the y-axis shows the measured response (for example, zone of inhibition, growth rate, or another biological response), while the x-axis shows the logarithm of the dose administered. A common slope is fit across the standard and test preparation(s), and the horizontal (log-dose) distance between their lines gives the estimated log relative potency. This method is particularly useful for assays where response increases (or decreases) linearly with the logarithm of dose over the tested range.
A parallel line assay is essential for establishing that a test preparation's potency can be legitimately expressed relative to a recognized standard. It confirms, through formal validity tests, that the dose-response relationship is statistically significant, that the lines for each preparation are parallel, and that the relationship is linear over the dose range tested — three checks required before a potency estimate can be considered valid.
The parallel line method is widely used in the pharmaceutical and biotechnology industries — for example, to determine the potency of antibiotics, vaccines, and other biological products — in line with regulatory expectations such as USP <111> (Design and Analysis of Biological Assays) and European Pharmacopoeia 5.3 (Statistical Analysis of Results of Biological Assays). It provides potency estimates together with confidence limits, supporting release testing, stability assessment, and regulatory submissions.
When to use Bioassay — Parallel Line Method?
The Parallel Line Method is used when comparing the potency of one or more test preparations against a standard preparation, and the measured response is expected to be linearly related to the logarithm of dose. It is commonly used in microbiological and biological potency assays — such as antibiotic, hormone, or vaccine assays — where a Standard and Test preparation(s) are each tested at multiple dose levels, and the two (or more) dose-response lines are expected to run parallel.
Guidelines for correct usage of Bioassay — Parallel Line Method
- Include a clearly labeled Standard preparation and at least one Test preparation in the Preparation column
- Use at least 3 dose levels per preparation wherever possible, so that linearity can be tested
- Ensure dose values are strictly positive (the method works on log(dose); zero or negative doses are not valid)
- Where possible, keep the ratio between successive doses the same across preparations (a "symmetrical" design), which simplifies interpretation
- Collect enough replicates per dose-preparation combination to estimate the residual error precisely
- Always check the three validity tests — Significance of Regression, Parallelism, and Linearity — before reporting a potency result
- Assign realistic values for Assumed Standard Potency and Assumed Test Preparation Potency so the estimated potency is expressed in the correct units
Alternatives: When not to use Bioassay — Parallel Line Method
If the measured response is expected to be linearly related to dose itself (not the logarithm of dose), and the assay includes a zero-dose (blank) treatment, use the Slope Ratio Method instead. If the response is quantal (for example, alive/dead, responded/did not respond) rather than a continuous measurement, a Quantal Response Method is more appropriate.
Example of Bioassay — Parallel Line Method?
A quality control analyst at a pharmaceutical company wants to determine the potency of a newly manufactured batch of an antibiotic (Test preparation) relative to the reference Standard. The analyst prepares both preparations at three concentrations (2, 4, and 8 µg/mL) and measures the zone of inhibition (in mm) produced against a test organism, with 4 replicate plates per concentration per preparation. The analyst follows these steps:
- Gathered the necessary data.
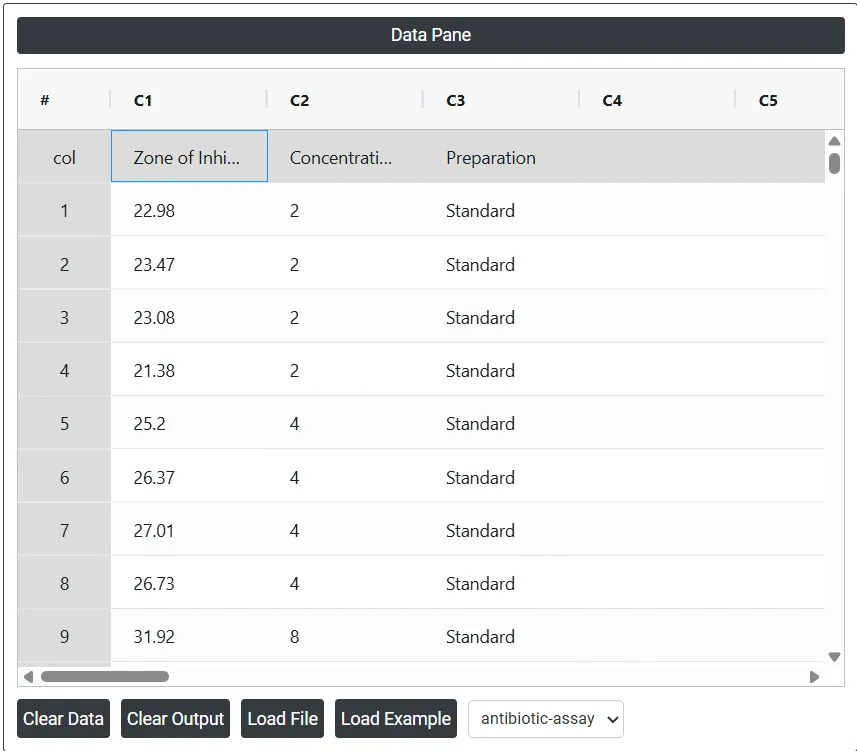
- Now analyses the data with the help of https://statsai.zometric.com/.
- To find Bioassay — Parallel Line Method, choose intelliqs.zometric.com > Statistical module > Regression > Bioassay — Parallel Line Method.
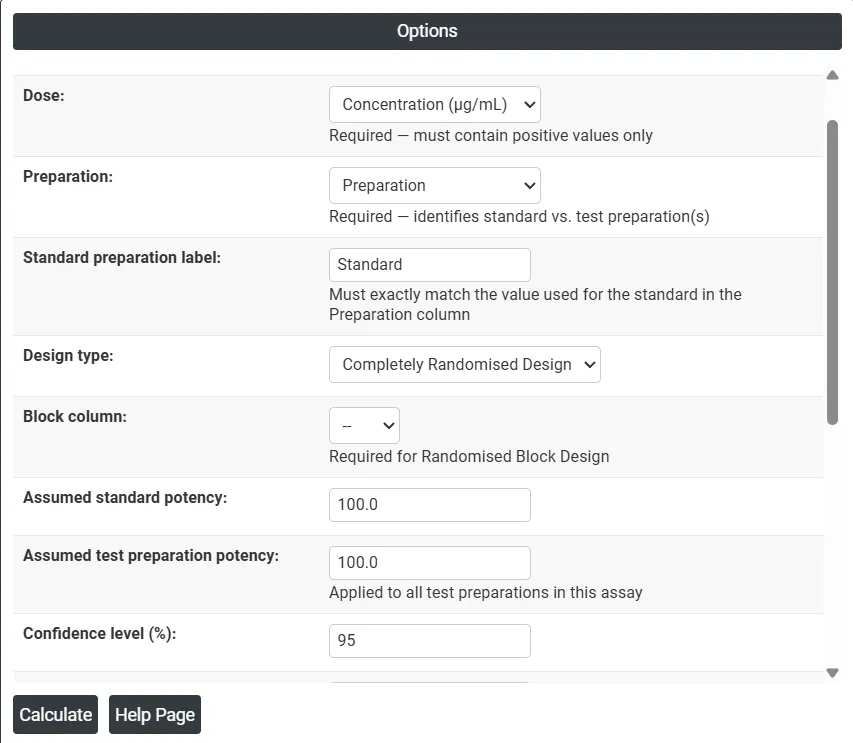
- Inside the tool, feeds the data along with other inputs as follows:
- After using the above mentioned tool, fetches the output as follows:
How to generate Bioassay — Parallel Line Method?
The guide is as follows:
- Login in to Stats AI account with the help of https://statsai.zometric.com/
- On the home page, choose Statistical Tool > Regression > Bioassay — Parallel Line Method.
- Click on Bioassay — Parallel Line Method and will reach the dashboard.
- Next, update the data manually or can completely copy (Ctrl+C) the data from excel sheet and paste (Ctrl+V) it here.
- Next, you need to select the Response, Dose, and Preparation columns, enter the Standard preparation label, and set the desired options.
- Finally, click on calculate at the bottom of the page and you will get desired results.
On the dashboard of Bioassay — Parallel Line Method, the window is separated into two parts.
On the left part, Data Pane is present. Data can be fed manually or the one can completely copy (Ctrl+C) the data from excel sheet and paste (Ctrl+V) it here.
- Load example: Sample data will be loaded.
- Load File: It is used to directly load the excel data.
On the right part, there are many options present as follows:
- Response: The column containing the measured biological response (e.g., zone of inhibition, absorbance).
- Dose: The column containing the dose or concentration administered. Values must be strictly positive.
- Preparation: The column identifying which preparation (Standard or Test) each observation belongs to.
- Standard preparation label: The exact text used in the Preparation column to identify the standard (e.g., "Standard").
- Design type: Choose Completely Randomised Design, or Randomised Block Design if a Block column should be accounted for.
- Block column: Required only for a Randomised Block Design; identifies the blocking factor (e.g., plate or run).
- Assumed standard potency / Assumed test preparation potency: The nominal (labelled) potency of the standard and test preparation(s), used to convert the relative potency into absolute estimated potency.
- Confidence level: The confidence level (%) used for the potency confidence limits.
- Potency CI error term: Which variance feeds the potency confidence limits. "Pure error" requires replicate observations per preparation/dose, as required by EP 5.3. (learn more)
- Compliance lower limit / Compliance upper limit: The acceptable range (%) for the estimated relative potency, used to flag Pass/Fail compliance.
- Logarithm base: Natural log or log base 10 — the transformation applied to the Dose column.
- Significance level for validity tests (α): The significance threshold used for the Regression, Parallelism, and Linearity validity tests.
- Outlier threshold: The |standardized residual| value above which a case diagnostic row is flagged as an outlier.
- Show case diagnostics table / Show normality-homogeneity tests / Show dose-response graph: Toggles to include or exclude these sections from the output.
- Download as Excel: This will display the result in an Excel format, which can be easily edited and reloaded for calculations using the load file option.