
Bioassay - Quantal Response Method
On this page
What is Bioassay — Quantal Response Method?
The Quantal Response Method is a statistical procedure used to estimate relative potency and effective dose (ED) values from bioassays where the measured outcome is binary (quantal) — for example, whether an animal survived or died, or whether a subject responded or did not respond — rather than a continuous measurement.
In a quantal response assay, each dose group reports the number of subjects responding out of the total number of subjects tested. A generalized linear model (using a logit, probit, gompit, or log-log link function) is fit on the log(dose) scale, with a common slope shared across the standard and test preparation(s), giving both an effective dose (such as ED50, the dose expected to produce a response in 50% of subjects) and a relative potency estimate.
Validity is confirmed via likelihood-ratio chi-square tests for the significance of the dose-response relationship, parallelism between preparations, and linearity of the fitted model — the quantal-response equivalent of the validity checks used in the Parallel Line Method.
The Quantal Response Method is used in toxicology, vaccine, and other biological potency testing — for example, LD50/ED50 determination — in line with USP <111> and European Pharmacopoeia 5.3.
When to use Bioassay — Quantal Response Method?
Use the Quantal Response Method when the measured response for each subject is binary (responded/did not respond) rather than a continuous measurement, and you need to estimate an effective dose (e.g. ED50) or compare potency between a standard and one or more test preparations.
Guidelines for correct usage of Bioassay — Quantal Response Method
- Ensure 0 <= Response <= Subject for every row (Response cannot exceed the total number of subjects tested)
- Use at least 3-4 dose levels per preparation so the dose-response curve and its validity can be properly assessed
- Choose the link function that best matches the biological response mechanism — logit and probit are the most common defaults
- Ensure the dose range tested spans a reasonable portion of the response curve (ideally from near 0% to near 100% response) for reliable ED50 estimation
- Enable the Spearman-Karber option as a distribution-free cross-check on the ED50 estimate, particularly useful if you are unsure the chosen link function is a good fit
- Always check the validity tests before reporting an ED value or potency result
Alternatives: When not to use Bioassay — Quantal Response Method
If the measured response is a continuous measurement rather than binary, use the Parallel Line Method, Slope Ratio Method, or Four-Parameter Logistic Method instead, depending on whether the response is linear in log(dose), linear in dose, or sigmoidal.
Example of Bioassay — Quantal Response Method?
A toxicology researcher measures mortality in groups of 40 test subjects, dosed at 4 concentration levels, for a Standard and a Test preparation, and wants to compare relative potency (LD50 ratio). The researcher follows these steps:
- Gathered the necessary data.
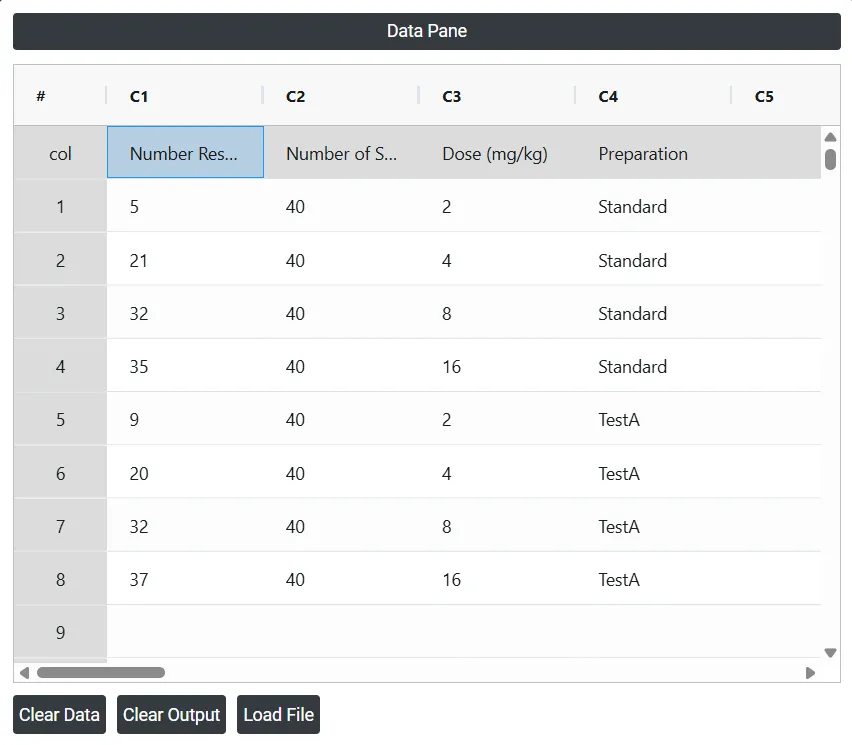
- Now analyses the data with the help of https://statsai.zometric.com/.
- To find Bioassay — Quantal Response Method, choose intelliqs.zometric.com > Statistical module > Regression > Bioassay — Quantal Response Method.
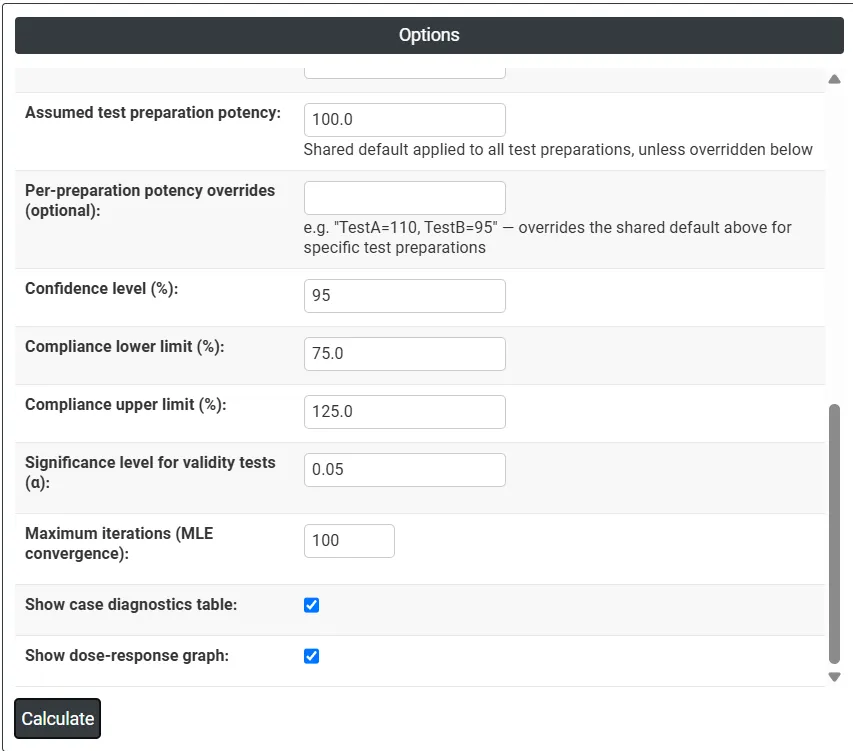
- Inside the tool, feeds the data along with other inputs as follows:
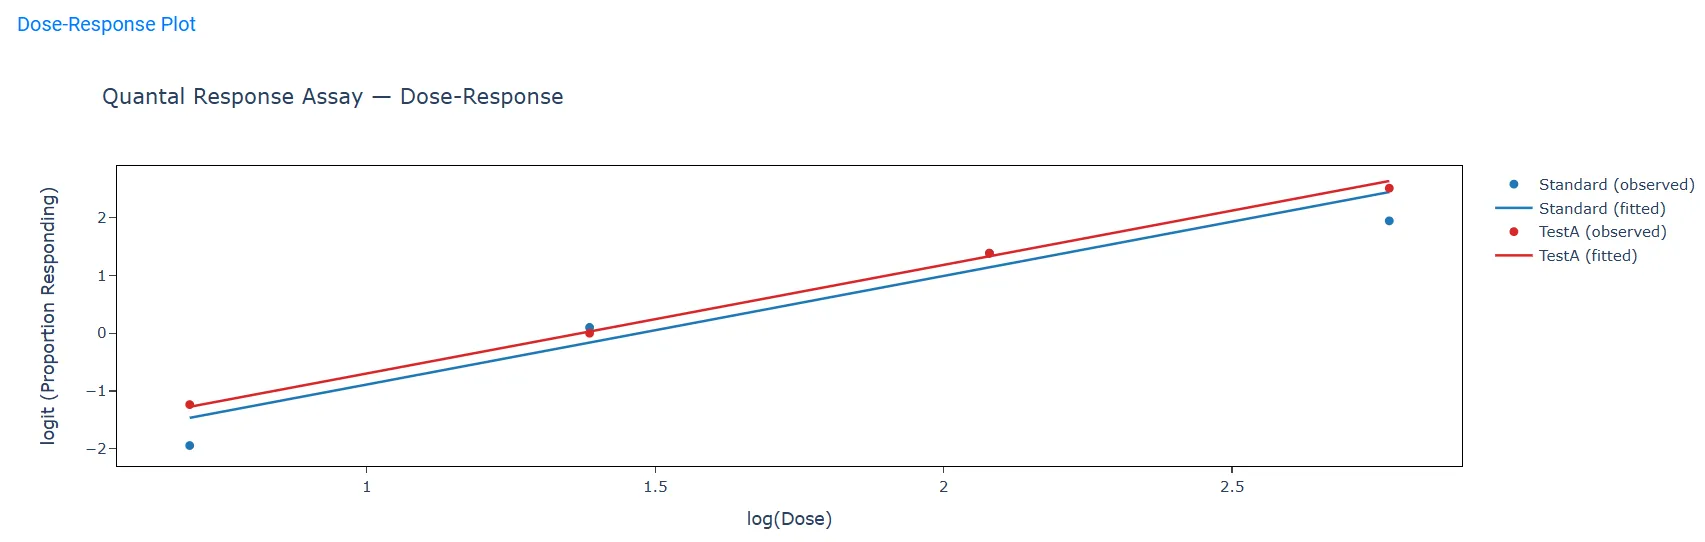
- After using the above mentioned tool, fetches the output as follows:
How to generate Bioassay — Quantal Response Method?
The guide is as follows:
- Login in to Stats AI account with the help of https://statsai.zometric.com/.
- On the home page, choose Statistical Tool > Regression > Bioassay — Quantal Response Method.
- Click on Bioassay — Quantal Response Method and will reach the dashboard.
- Next, update the data manually or can completely copy (Ctrl+C) the data from excel sheet and paste (Ctrl+V) it here.
- Next, you need to select the Response, Subject, Dose, and Preparation columns, enter the Standard preparation label, and choose the link function and effective dose percentiles.
- Finally, click on calculate at the bottom of the page and you will get desired results.
On the dashboard of Bioassay — Quantal Response Method, the window is separated into two parts.
On the left part, Data Pane is present. Data can be fed manually or the one can completely copy (Ctrl+C) the data from excel sheet and paste (Ctrl+V) it here.
- Load example: Sample data will be loaded.
- Load File: It is used to directly load the excel data.
On the right part, there are many options present as follows:
- Response: The column containing the number of subjects responding positively in each group.
- Subject: The column containing the total number of subjects in each group.
- Dose: The column containing the dose administered. Values must be strictly positive.
- Preparation: The column identifying which preparation (Standard or Test) each observation belongs to.
- Standard preparation label: The exact text used in the Preparation column to identify the standard (e.g., "Standard").
- Link function: Logit, Probit, Gompit (complementary log-log), or Log-log — the transformation relating dose to response probability.
- Logarithm base: Natural log or log base 10 — the transformation applied to the Dose column.
- Effective dose percentiles: Comma-separated percentiles to compute (e.g. "10, 50, 90" for ED10/ED50/ED90).
- Also compute ED50 via Spearman-Karber method: Adds a distribution-free cross-check alongside the model-based ED50.
- Assumed standard potency / Assumed test preparation potency: The nominal (labelled) potency of the standard and test preparation(s), used to convert the relative potency into absolute estimated potency.
- Confidence level: The confidence level (%) used for the ED and potency confidence limits.
- Compliance lower limit / Compliance upper limit: The acceptable range (%) for the estimated relative potency, used to flag Pass/Fail compliance.
- Validity test method: How the Regression/Non-parallelism/Non-linearity validity tests are computed. Finney's classical method is more numerically stable when a dose group has a 0% or 100% observed response. (learn more)
- Significance level for validity tests (α): The significance threshold used for the Regression, Parallelism, and Linearity validity tests.
- Maximum iterations: The maximum number of iterations allowed for the model fit to converge.
- Show case diagnostics table / Show dose-response graph: Toggles to include or exclude these sections from the output.
- Download as Excel: This will display the result in an Excel format, which can be easily edited and reloaded for calculations using the load file option.