
From Zone of Inhibition to Regulatory-Ready Potency: A Practical Guide to Bioassay Analysis
How Zometric Statistical AI takes bioassay teams from raw plate and dose-response data to defensible, compliant potency results — without a patchwork of spreadsheets
On this page
Ask anyone who has run a potency assay for a living, and they will tell you the hardest part is rarely the lab work. Plating the dilutions, reading the zones of inhibition, recording the number of animals or cells that responded at each dose — that part is routine. What keeps people up at night is what happens after the raw numbers come back: turning them into a potency estimate that a regulator, an auditor, or a customer's quality team will actually accept.
Bioassays are, by nature, indirect. Unlike a chemical assay where you can often measure a compound directly, a bioassay infers potency by comparing how a test article and a reference standard behave in a biological system — an organism, a cell line, a zone of bacterial growth, an all-or-nothing physiological response. That comparison only means something if it is built on a statistically sound dose-response model, checked against a battery of validity tests, and reported with a confidence interval that reflects the real uncertainty in the assay. Get any part of that wrong — an unparallel pair of lines, a bad link function, an underpowered replicate design — and the potency number is not just imprecise, it is unreliable in a way that will not show up until someone downstream questions it.
This is the world Zometric's Bioassay tools were built for: pharmacopoeial methods (Ph. Eur. / EP 5.3, USP <111>, USP <81>, ICH-aligned practice) implemented as production statistical software, not as one-off spreadsheet macros that live on a single analyst's laptop.
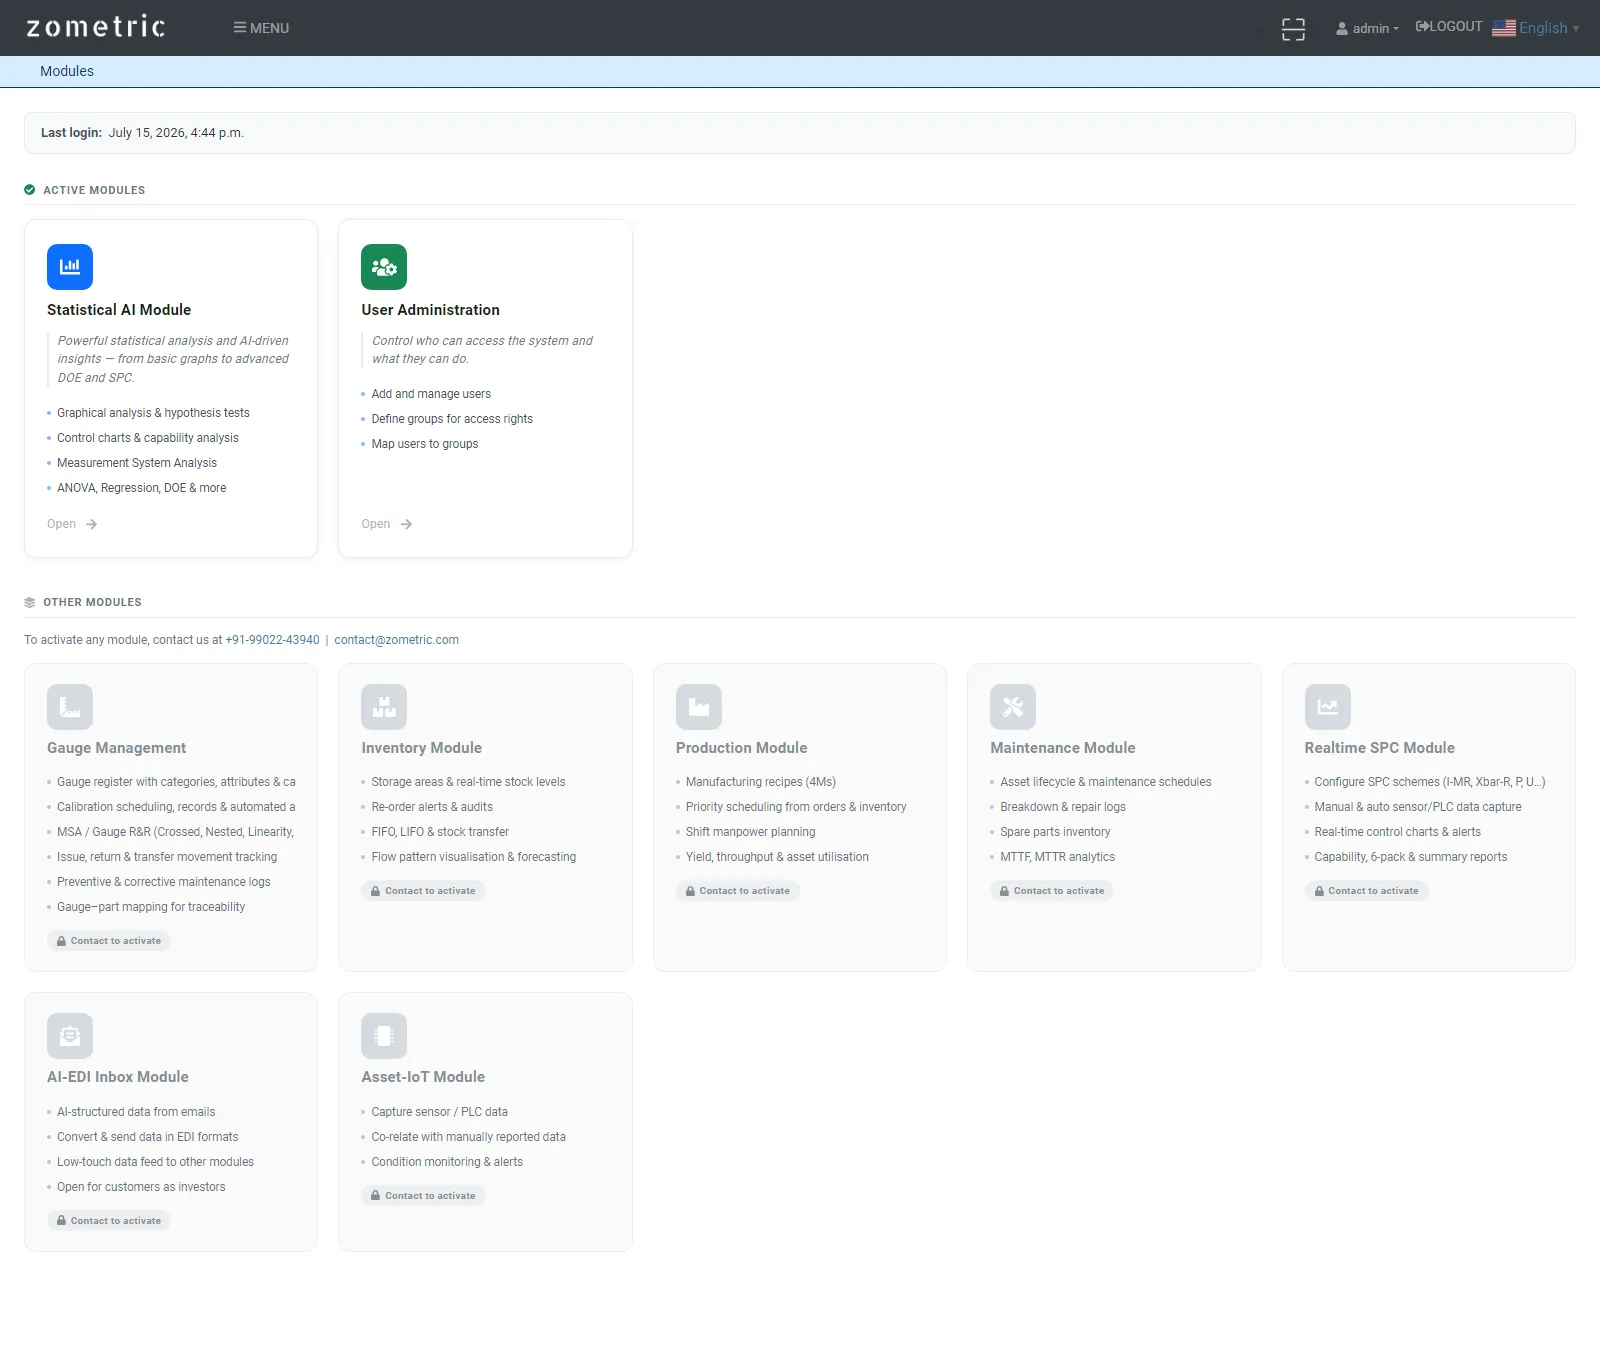
Zometric's Statistical AI module dashboard — the Bioassay tools sit alongside the rest of the platform's graphical analysis, control charts, MSA, and DOE capabilities.
Why Bioassay Statistics Are Genuinely Harder Than They Look
On the surface, a potency assay looks like a simple regression problem: plot response against dose, fit a line, read off where the test article's curve sits relative to the standard's. In practice, every one of those steps carries a compliance requirement behind it.
The dose axis has to be log-transformed for the comparison to be biologically meaningful. The test and standard curves have to be shown to be parallel (or, for slope-ratio designs, to share a common intercept) before a potency ratio is even allowed to be calculated — a step most compendia require you to test formally, not eyeball. The response itself might be continuous (a zone diameter, an optical density) or quantal (how many of the subjects at each dose responded at all), and each response type calls for a different model: linear regression for parallel-line and slope-ratio designs, a logit or probit generalized linear model for quantal response, a four-parameter logistic curve for the sigmoidal responses common in cell-based and ELISA-type assays. On top of the model, there is a full analysis of variance — significance of regression, non-parallelism, non-linearity — that has to pass before the potency result can be trusted at all, and a confidence interval around the potency (typically via Fieller's theorem) that has to be reported alongside the point estimate, not instead of it.
None of this is exotic statistics. It is well-established, decades-old methodology. But it is methodology with a lot of moving parts, several defensible conventions for the parts that are genuinely ambiguous (which error term feeds the potency confidence interval is a good example), and very little tolerance for a transcription error or a mis-specified design. That combination — routine but unforgiving — is exactly where general-purpose spreadsheets and one-off scripts tend to accumulate risk quietly, assay after assay, until someone finally asks the wrong question at the wrong time.
One Platform, the Right Method for Every Assay Design
Rather than force every bioassay through one generic curve-fitting tool, Zometric's Statistical AI module provides a dedicated tool for each recognized assay design, each one implementing the specific model, validity tests, and potency calculation that the corresponding design requires — and each one reachable from the same Workspace an analyst already uses for every other statistical tool in the platform.
Parallel Line and Slope Ratio Assays
For classical multi-dose comparative assays — antibiotic potency by agar diffusion, vaccine and hormone assays, and similar designs — the Parallel Line and Slope Ratio tools fit the standard and test preparations' dose-response lines, test formally for parallelism (or common intercept, for slope-ratio designs) and linearity, and report potency with a Fieller confidence interval. Completely randomized, randomized block, Latin square, and crossover designs are all supported, along with normality, homogeneity-of-variance, and outlier diagnostics on the underlying data — the same checks a statistician would run by hand before trusting a regression, just run automatically and reported alongside the result.
One detail worth calling out because it trips up a lot of home-grown spreadsheets: which error term feeds the potency confidence interval. Some labs' internal convention pools the regression residual across all sources of variation; Ph. Eur. 5.3 specifies using the pure within-group replicate error instead, which typically gives a narrower, more defensible interval. Both tools let an analyst choose either convention explicitly, rather than silently picking one and leaving the assumption buried in a formula.
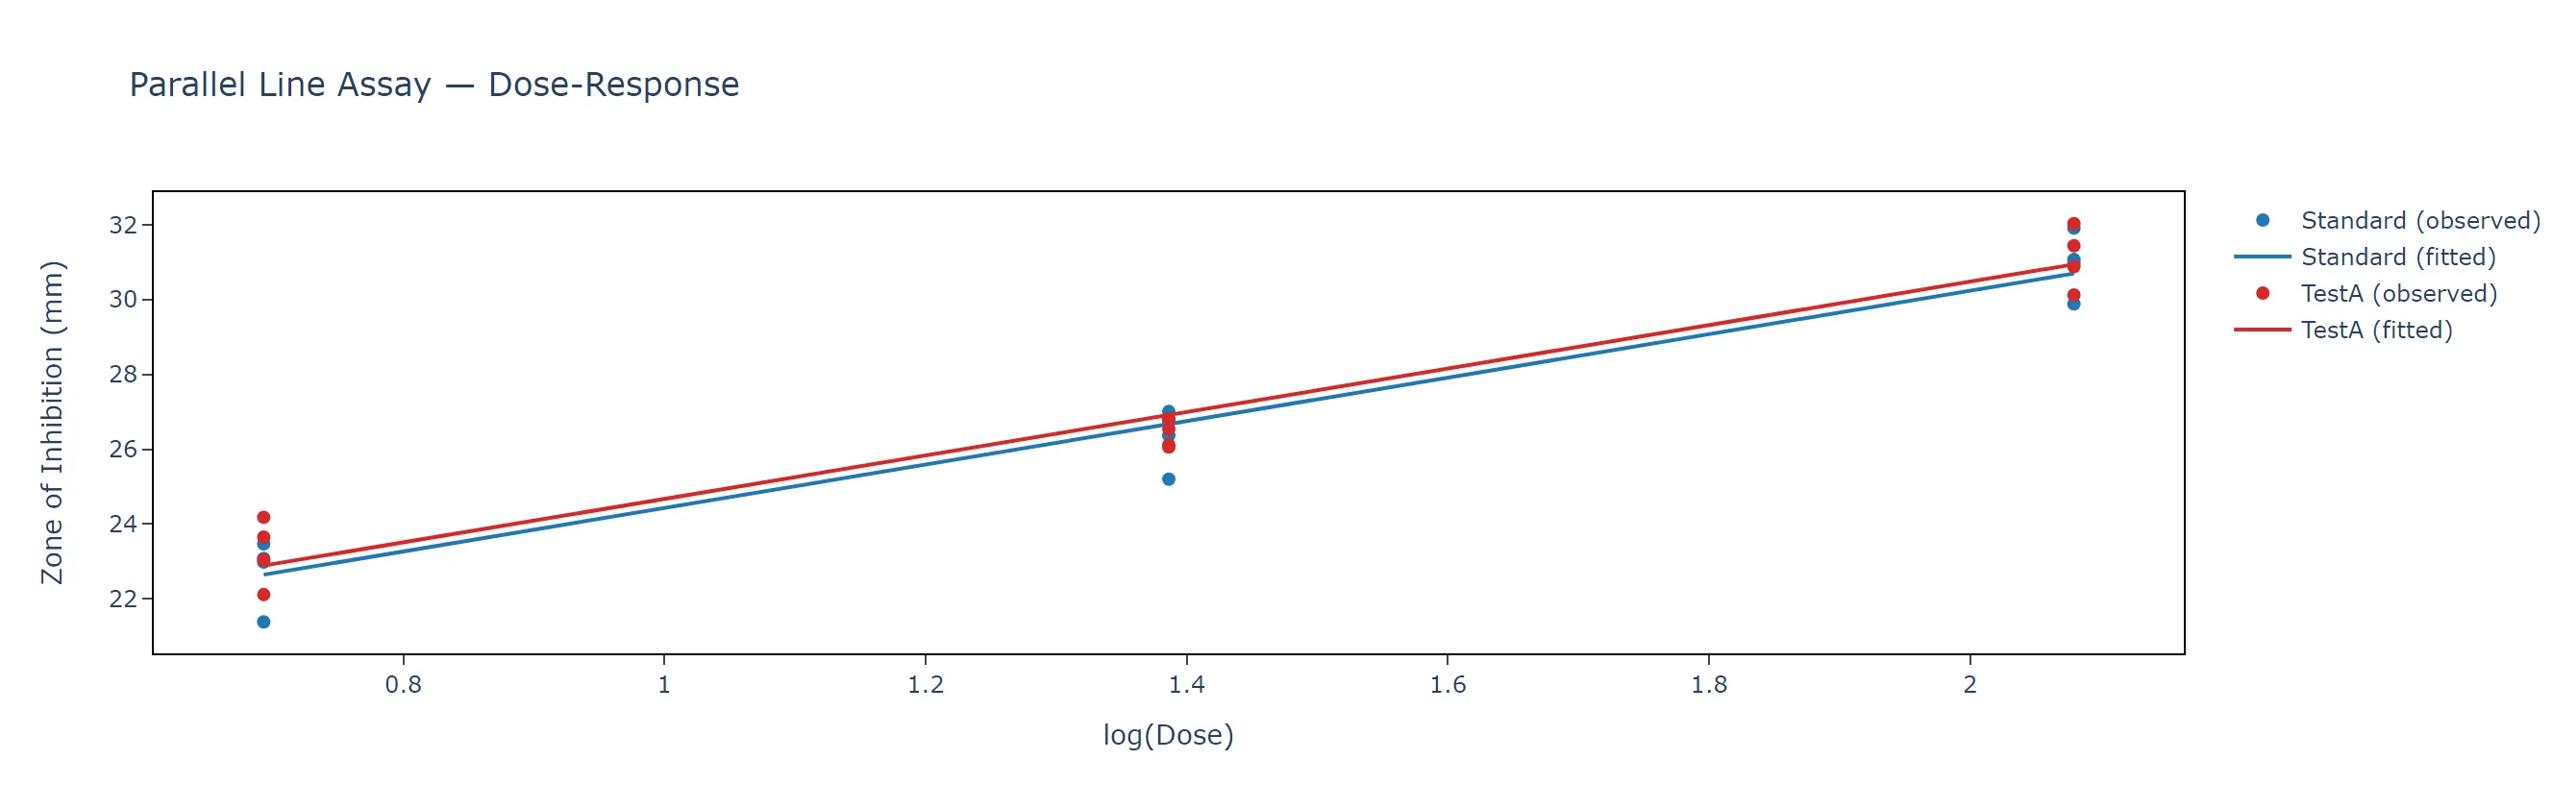
The fitted Parallel Line dose-response plot on an antibiotic zone-of-inhibition example — standard and test preparation lines, log(dose) on the x-axis, generated automatically alongside the full regression and validity output.

The resulting potency table for the same example — estimated potency, Fieller confidence interval, %precision, and a pass/fail compliance flag, read directly off the fitted lines.
Quantal Response Assays
Not every bioassay produces a continuous measurement. Toxicology, infectivity, and challenge studies typically record a simple yes/no outcome per subject at each dose — did the animal survive, did the culture show a cytopathic effect, did the subject respond. The Quantal Response tool fits these all-or-none outcomes with a generalized linear model (logit, probit, gompit, or log-log link, an analyst's choice), tests parallelism and linearity on the likelihood-ratio scale appropriate to a binomial model, and reports both effective doses (ED50 and any other percentile of interest) and relative potency versus the standard. Where a compendial method specifically calls for Finney's classical minimum chi-square validity test rather than a deviance-based test, that option is available explicitly — the tool does not force a single statistical convention onto every lab's compendial reference.
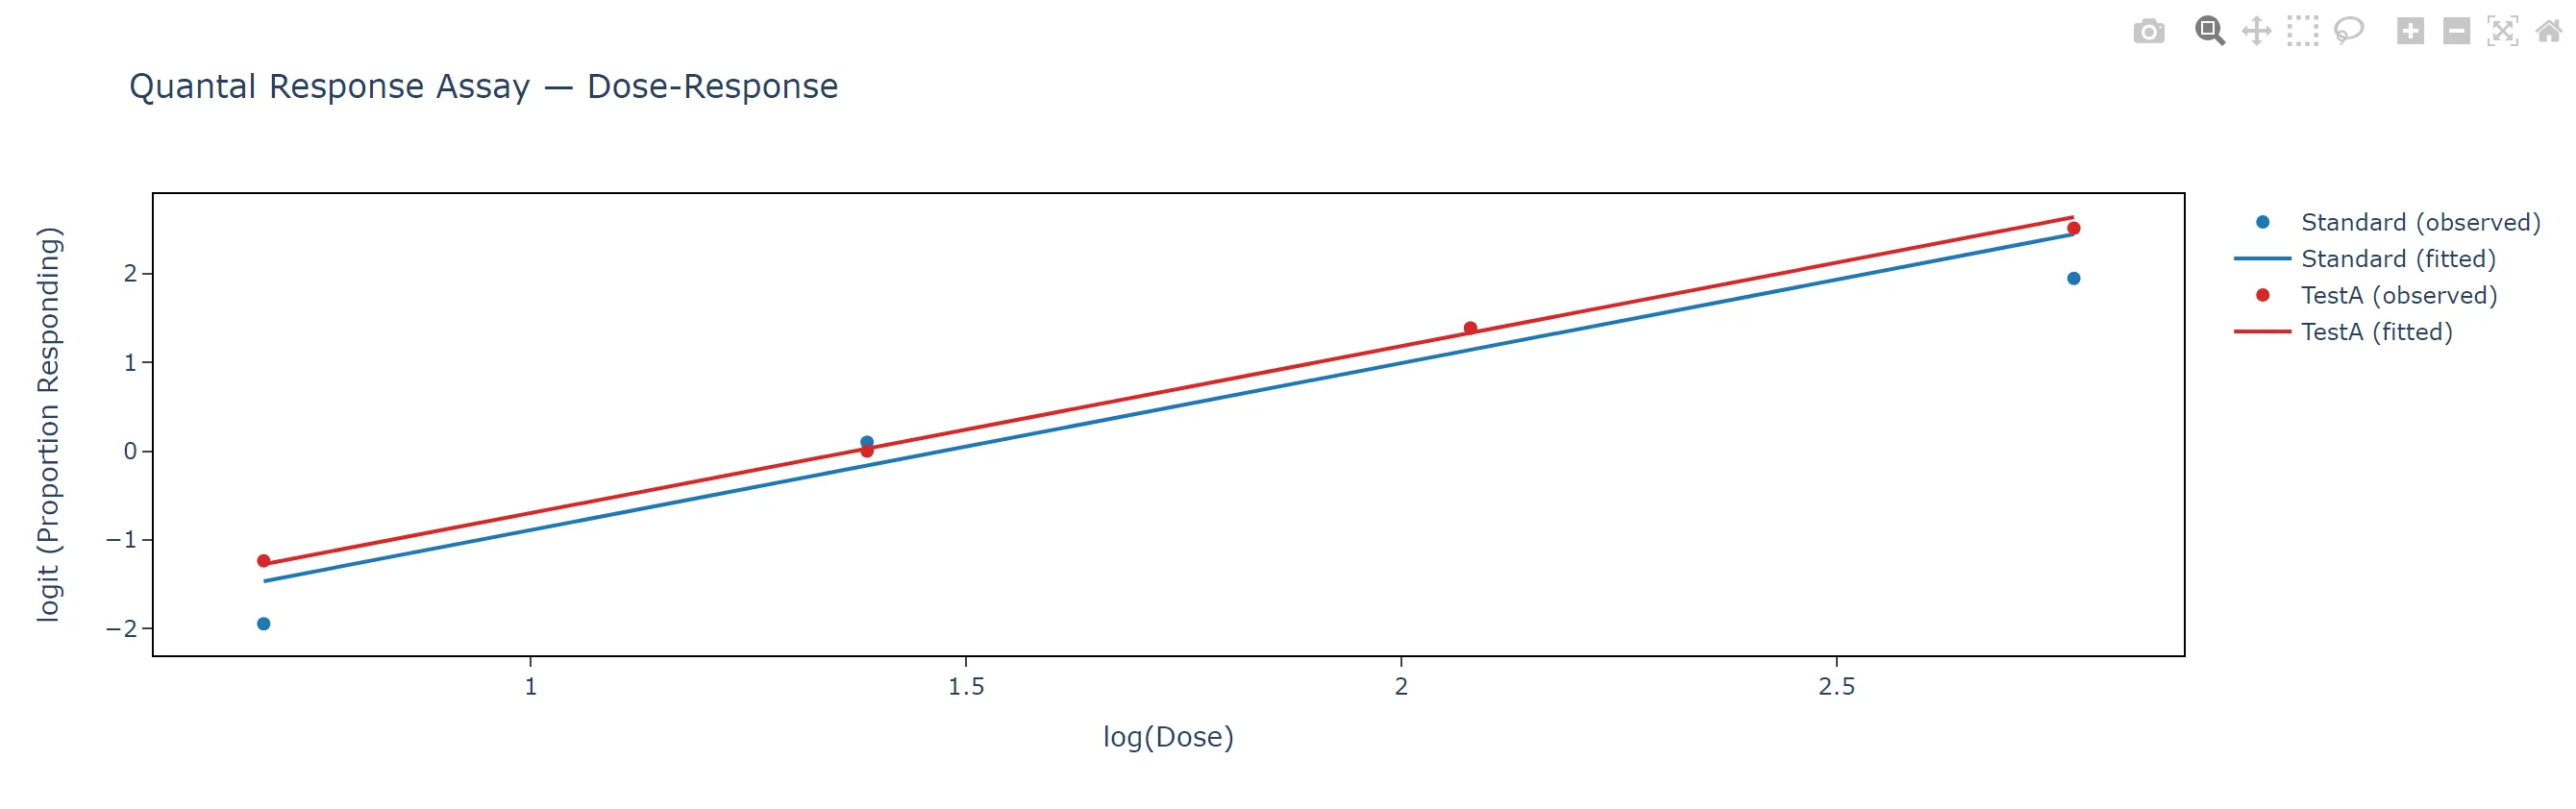
The fitted logistic dose-response curve on a toxicology example — proportion responding against log(dose) for the standard and test compound.

The corresponding potency table — relative potency, confidence interval, and %precision, computed from the fitted logit model.
Cylinder-Plate (Microbial) Assays
Microbial cylinder-plate potency assays, run under USP <81> / <21> or Ph. Eur. 2.7.2, add a wrinkle continuous-response assays elsewhere do not have to deal with: plate-to-plate variability. Because incubation conditions drift subtly from plate to plate, the compendial method corrects every reading against a reference zone measured on that same plate before any regression is fit. The Cylinder-Plate 5+1 tool automates exactly that correction — computing each plate's own correction point, adjusting every standard and sample reading against it, and only then fitting the single standard curve the potency estimate is read from — along with the %RSD and R² suitability checks USP <81> requires before a result can be reported at all. Two further options, added after benchmarking the tool against a published compendial worked example, cover situations the base method does not: scoring one sample as several independent replicate determinations that get combined into a single pooled potency with its own precision check, and separating a reference standard's actual prepared concentration (which anchors the curve) from its nominal label potency (which the final percent-of-reference result should be reported against) when the two differ slightly.
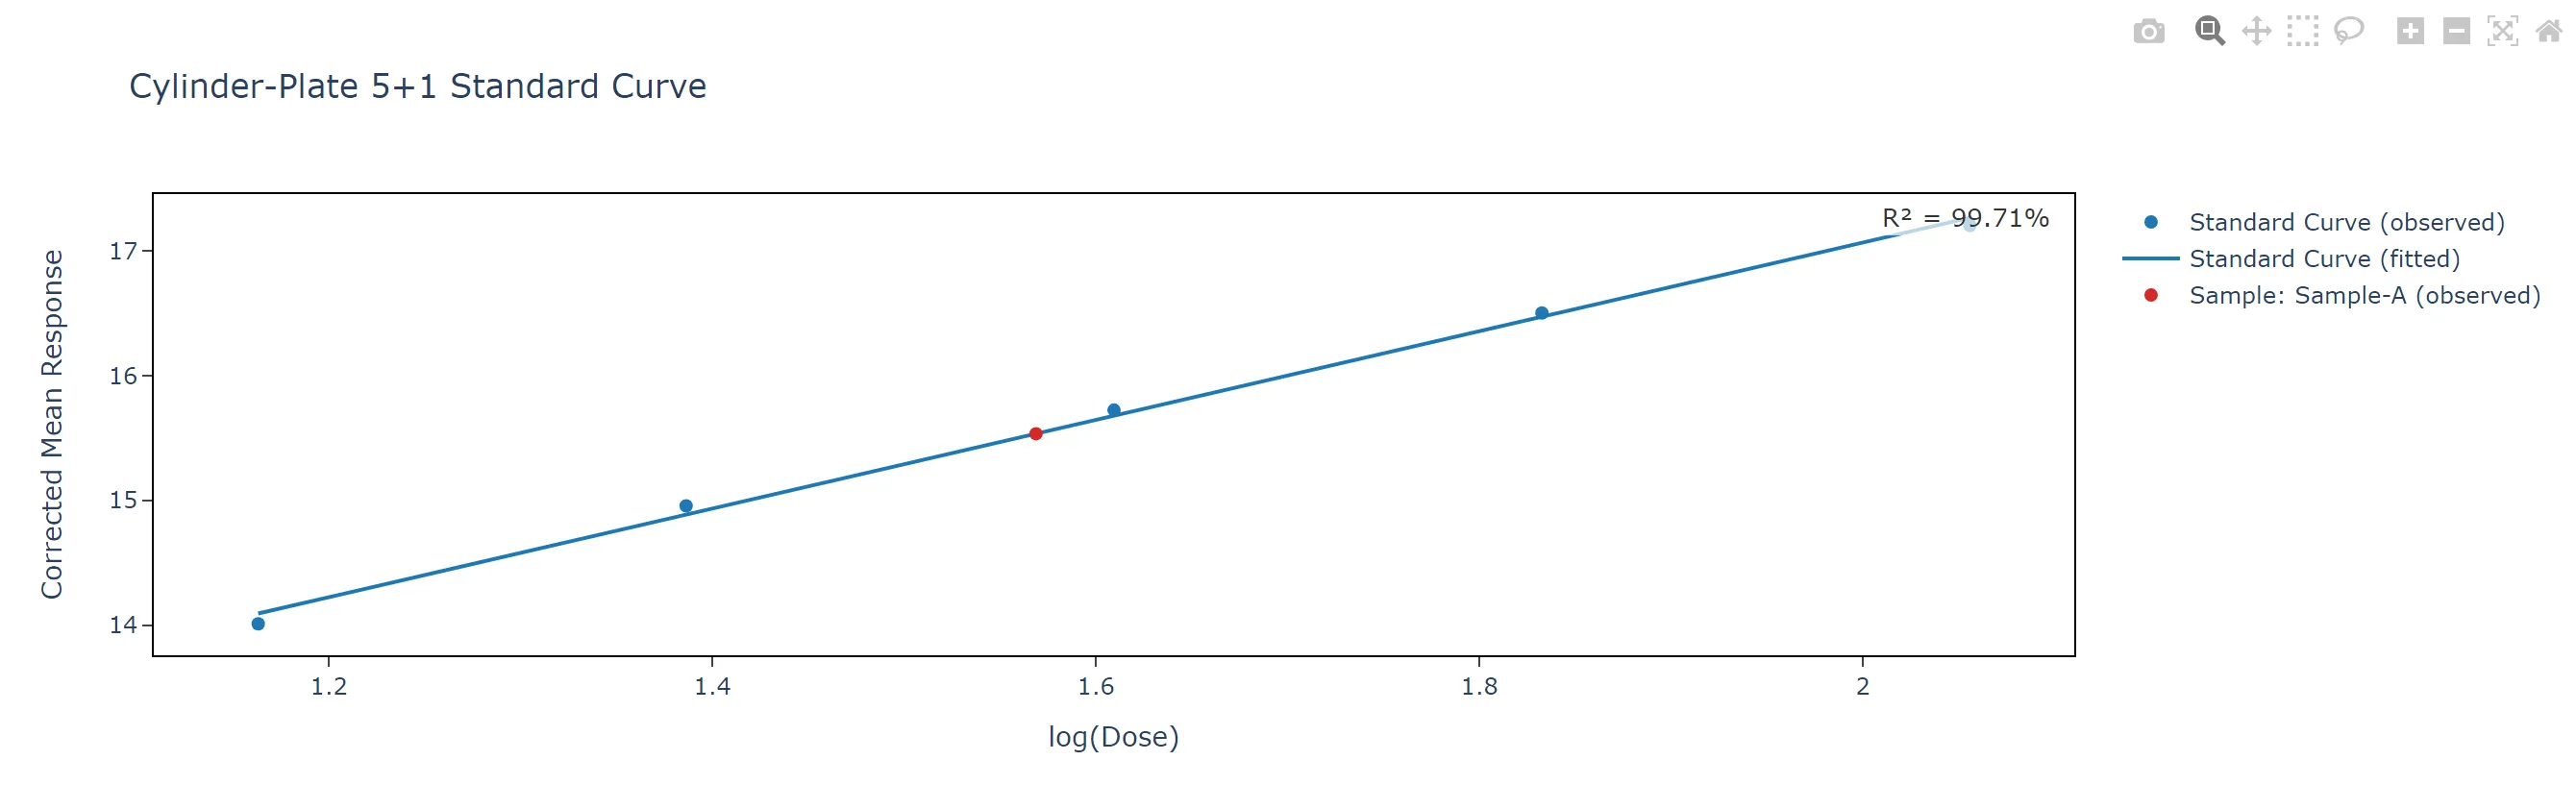
The corrected standard curve on a USP <81> antibiotic example, with the test sample's corrected mean plotted against it and the curve's R² annotated directly on the chart.

The resulting potency table — interpolated concentration and relative potency for the sample, with its own confidence interval and precision.
Four-Parameter Logistic and Combine Assays
Cell-based potency and ligand-binding assays — ELISA, reporter-gene, and similar formats — typically produce an S-shaped, not a straight-line, dose-response curve. The Four-Parameter Logistic tool fits that sigmoidal curve directly, tests parallelism between test and standard on the shared-slope model these assays call for, and reports potency the same way the linear-model tools do — same rigor, matched to a genuinely different curve shape.
And because a single potency result from a single run is rarely the end of the story, the Combine Assays tool pools independently run assays — whether that is several runs of the same product over time for release testing, or several labs' results for a comparability exercise — into one combined potency estimate and confidence interval, using either inverse-variance weighting or the Ph. Eur. 5.3 combination convention, with the option to see exactly how much each individual run contributed to the pooled result.
A Workspace, Not a Pile of Spreadsheets
Every one of these tools lives in the same place every other statistical tool in the platform does: Zometric's Workspace. Data loaded once is available to every tool an analyst opens on it, results carry the assay's own audit trail rather than a formula chain buried in a workbook, and every output can be exported as a PDF report formatted for a batch record or a regulatory submission, not just as numbers to copy into a report by hand.
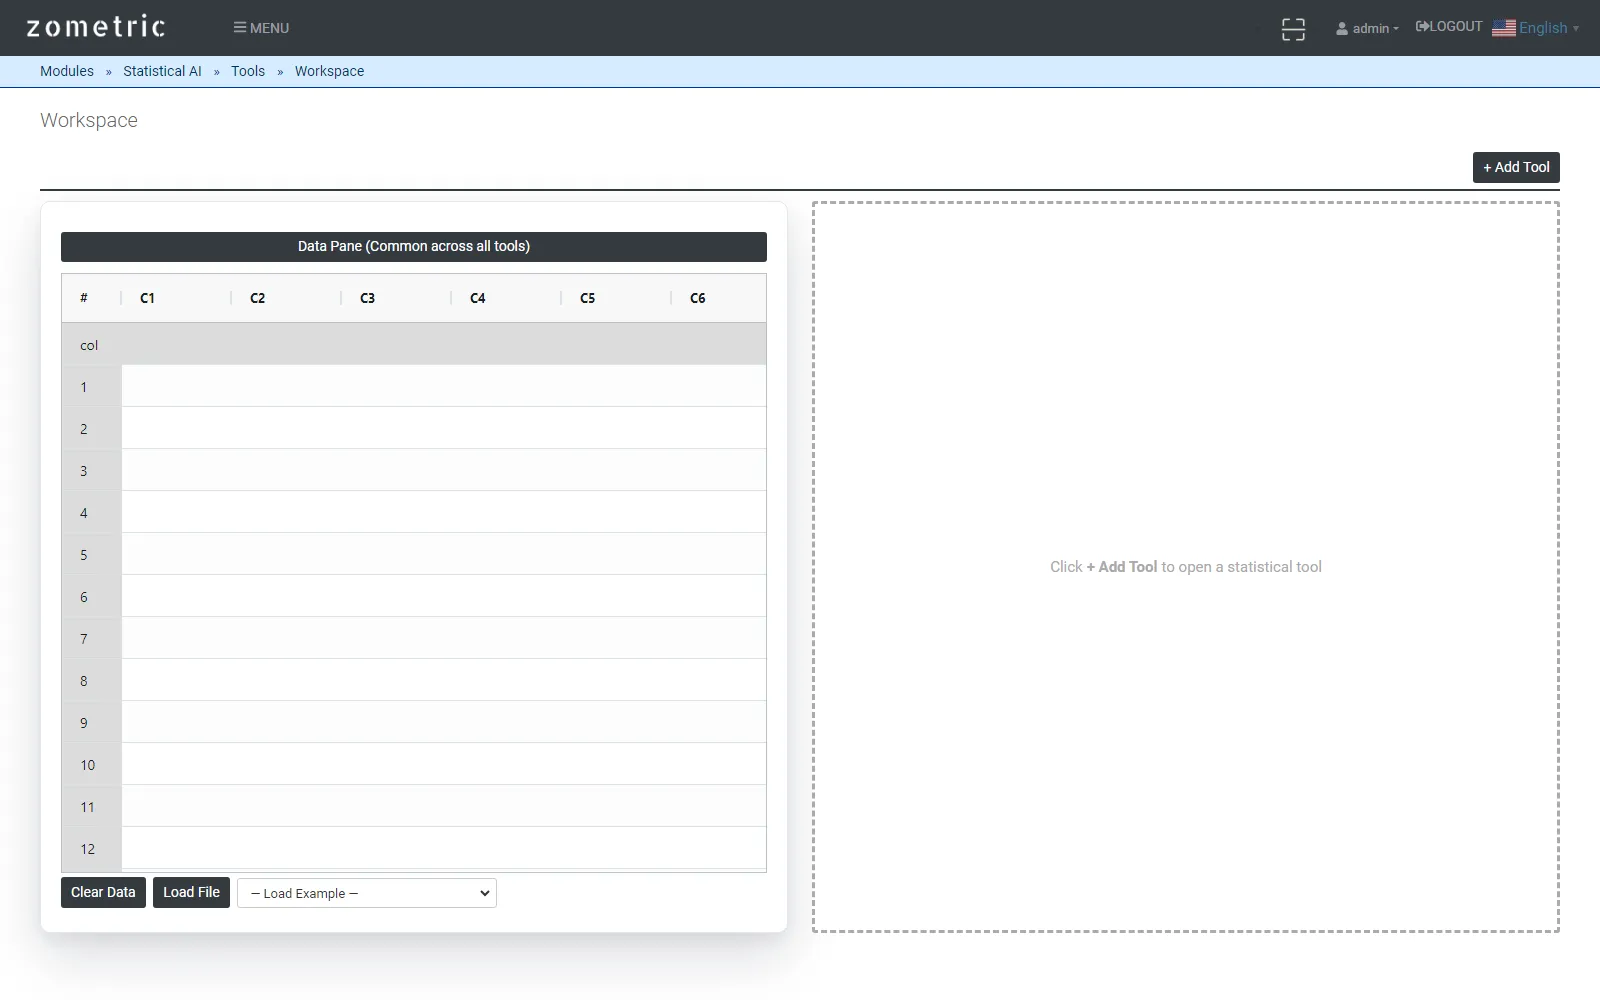
Zometric's Workspace — the same data pane feeds any statistical tool an analyst adds, keeping bioassay analysis, control charts, and every other method a lab runs in one connected environment instead of scattered across spreadsheets.
That matters more than it might sound. A potency result that took twenty minutes to compute in a spreadsheet, with the validity tests run separately (or skipped), the confidence interval hand-calculated, and the final report assembled by copying numbers into a template, is a result that is expensive to reproduce and easy to get subtly wrong. The same analysis run through a dedicated tool that enforces the compendial method, runs every required validity check automatically, and produces a complete, reviewable report in the same click that produced the number takes a fraction of the time — and leaves a far shorter list of places an error could have hidden.
Built on the Methods Regulators Already Expect
None of this replaces the judgment of the statistician or the assay scientist running the analysis. What it does is take the well-established, compendial parts of that judgment — the model, the validity tests, the confidence interval convention — out of ad hoc spreadsheet formulas and into software built specifically to implement them correctly, consistently, and the same way every time, for every analyst, on every assay.
"The math behind a bioassay has not changed in decades. What has changed is how much scrutiny the result gets before anyone will act on it — and that is exactly the gap Zometric's Bioassay tools are built to close."
If your team is running parallel-line, slope-ratio, quantal response, cylinder-plate, four-parameter logistic, or multi-run combined potency assays — or juggling more than one of those at once — Zometric's Bioassay tools are built to take that work off spreadsheets and onto a platform your quality and regulatory teams can actually stand behind. Reach out to the Zometric team to see the full Bioassay toolset in action on your own assay data.