
Automated Process Capability
On this page
Purpose
Automated Process Capability removes the manual step of first testing normality and then separately choosing between a Normal or a Nonnormal capability model. The tool runs the Anderson-Darling normality test itself, and automatically routes the calculation to standard Normal capability indices when the data passes, or to a best-fit Nonnormal distribution (selected from the app's candidate-distribution library) when it does not — producing one report with the routing decision documented at the top.
Key Capabilities
- Runs the Anderson-Darling normality test automatically — no separate normality-check step required.
- Auto-selects the best-fitting nonnormal candidate distribution when the Normal assumption is rejected, using the same distribution-fitting library as the app's other nonnormal capability tools.
- Configurable normality p-value threshold so users can tune how conservatively the tool defaults to the Normal path.
- Reports which path was taken (Normal vs. Nonnormal, and which distribution) directly in the output, so the routing decision is transparent and auditable.
- Supports an optional Factor column and a “Compare selected columns as separate groups” mode, consistent with the app's other capability tools.
Statistical Methods
Normality is assessed with the Anderson-Darling test (scipy's anderson() against a Normal reference), using the standard small-sample correction AD = A²·(1 + 0.75/n + 2.25/n²), with the p-value derived from the D'Agostino–Stephens piecewise empirical approximations for the corrected AD statistic.
Routing rule: if the Anderson-Darling p-value is greater than or equal to the Normality p-value threshold (default 0.1), the tool treats the data as Normal — it estimates σ_overall via the moving-range method (MRbar/d2, or a median-moving-range variant) and computes the standard z-based Performance indices Pp, Ppl, Ppu, Ppk from it. If the p-value falls below the threshold, the tool instead fits each candidate nonnormal distribution the app supports (Weibull, 3-Parameter Weibull, Exponential, 2-Parameter Exponential, Gamma, Logistic, Loglogistic, Lognormal, and the Smallest/Largest Extreme Value distributions) by maximum likelihood, ranks them by goodness-of-fit, and auto-selects the best-fitting one.
For the Nonnormal path, the selected distribution's own CDF is evaluated at LSL and USL to get tail probabilities p_lsl and p_usl, which are then converted to equivalent standard-Normal z-scores via the inverse Normal CDF (norm.ppf) — the “z-score method.” Capability is then reported on the familiar Cpk scale using those z-scores: Pp = (z_usl − z_lsl) / 6, PPL = −norm.ppf(p_lsl) / 3, PPU = norm.ppf(p_usl) / 3, Ppk = min(PPL, PPU) — so a skewed distribution's real tail risk is captured before being expressed in the same Cpk-like units used throughout the app, rather than misapplying a raw Normal Z-score to non-Normal data.
PPM (parts-per-million) figures are reported two ways: “expected” PPM from the fitted distribution's tail probabilities beyond each spec limit, and “observed” PPM from simply counting the fraction of the raw sample that actually falls outside the spec limits.
Input Fields & Options
Field | Description |
Choose columns | The response column(s) to analyze. |
Factor | Optional. Compare capability across groups when the data is a single Response column plus a Factor column. |
Compare selected columns as separate groups | When 2+ columns are selected, run capability separately for each and compare side-by-side. |
LSL / USL | Lower and upper specification limits, applied to every selected column. |
Normality p-value threshold | Default 0.1. If the Anderson-Darling p-value is at or above this, capability is computed assuming Normal; below it, the best-fitting nonnormal distribution is auto-selected and used instead. |
Download as Excel | Optional. Exports the report to an Excel workbook. |
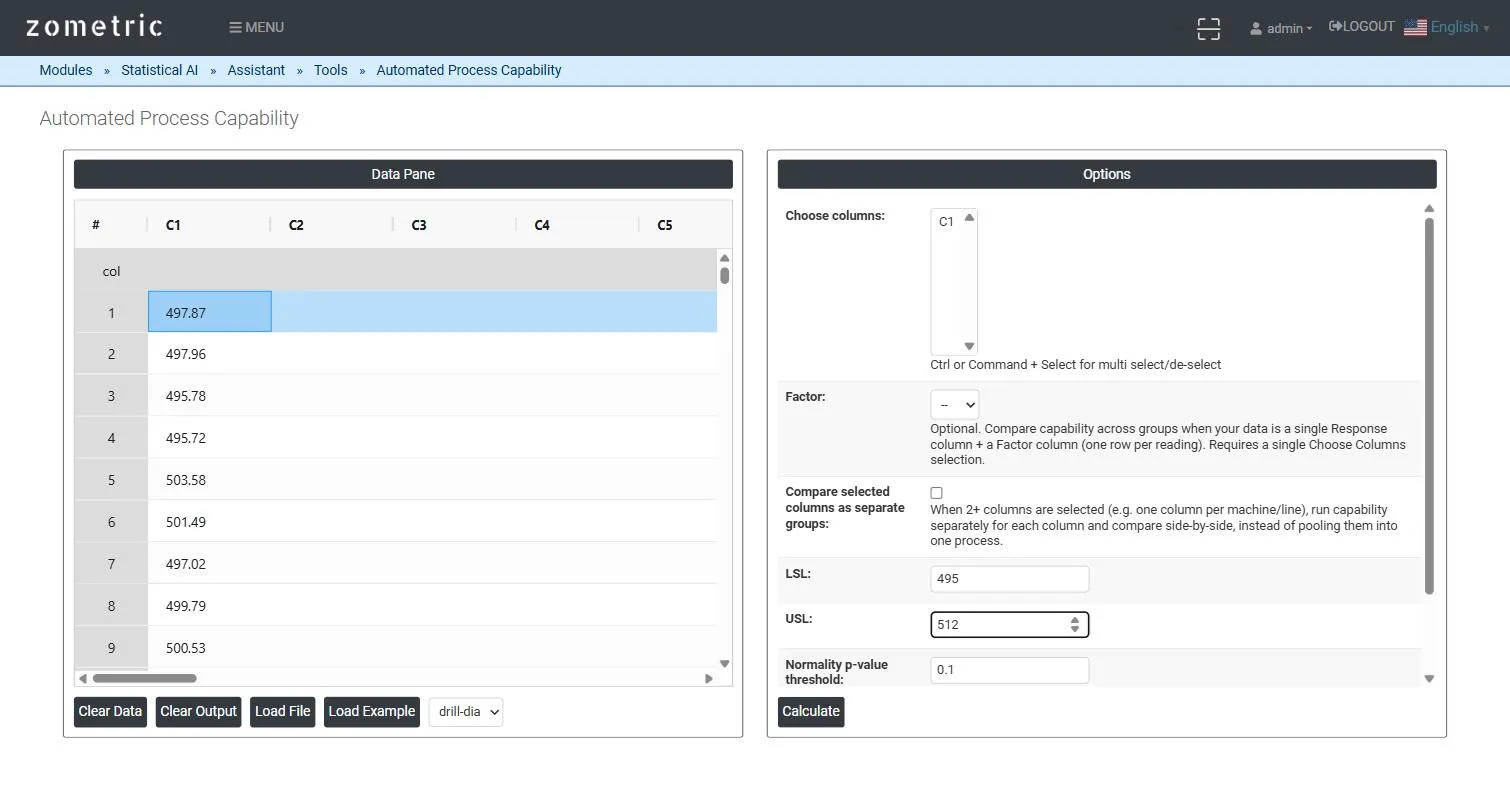
Figure 1 — Data pane with 60 fill-weight readings pasted into C1, LSL/USL and Normality p-value threshold filled in on the Options panel.
Output Descriptions
- Normality test result — the Anderson-Darling statistic and p-value, and the path taken (Normal, or the specific nonnormal distribution auto-selected).
- Histogram of the fitted distribution — sample histogram with the fitted density curve and LSL/USL reference lines overlaid.
- Distribution parameter table — LSL, USL, sample mean, sample size, and the fitted distribution's shape/scale (or equivalent) parameters.
- Capability indices — Pp, Ppl, Ppu, Ppk computed from whichever distribution was selected.
- PPM tables — expected PPM (from the fitted distribution's tails) and observed PPM (from the raw sample), each split into PPM < LSL, PPM > USL and PPM Total.
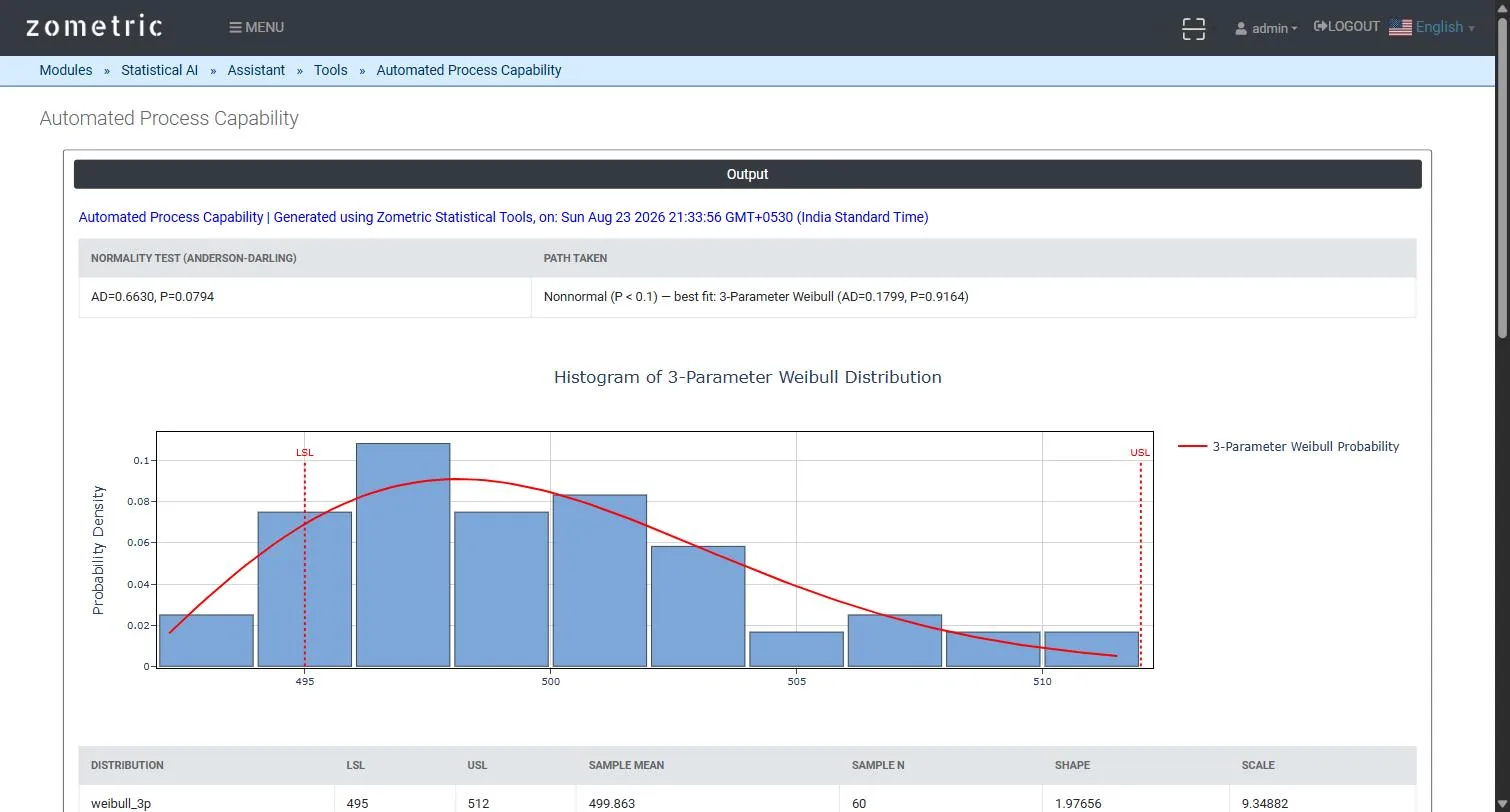
Figure 2 — Distribution parameters and the resulting Pp/Ppl/Ppu/Ppk indices with expected and observed PPM tables.
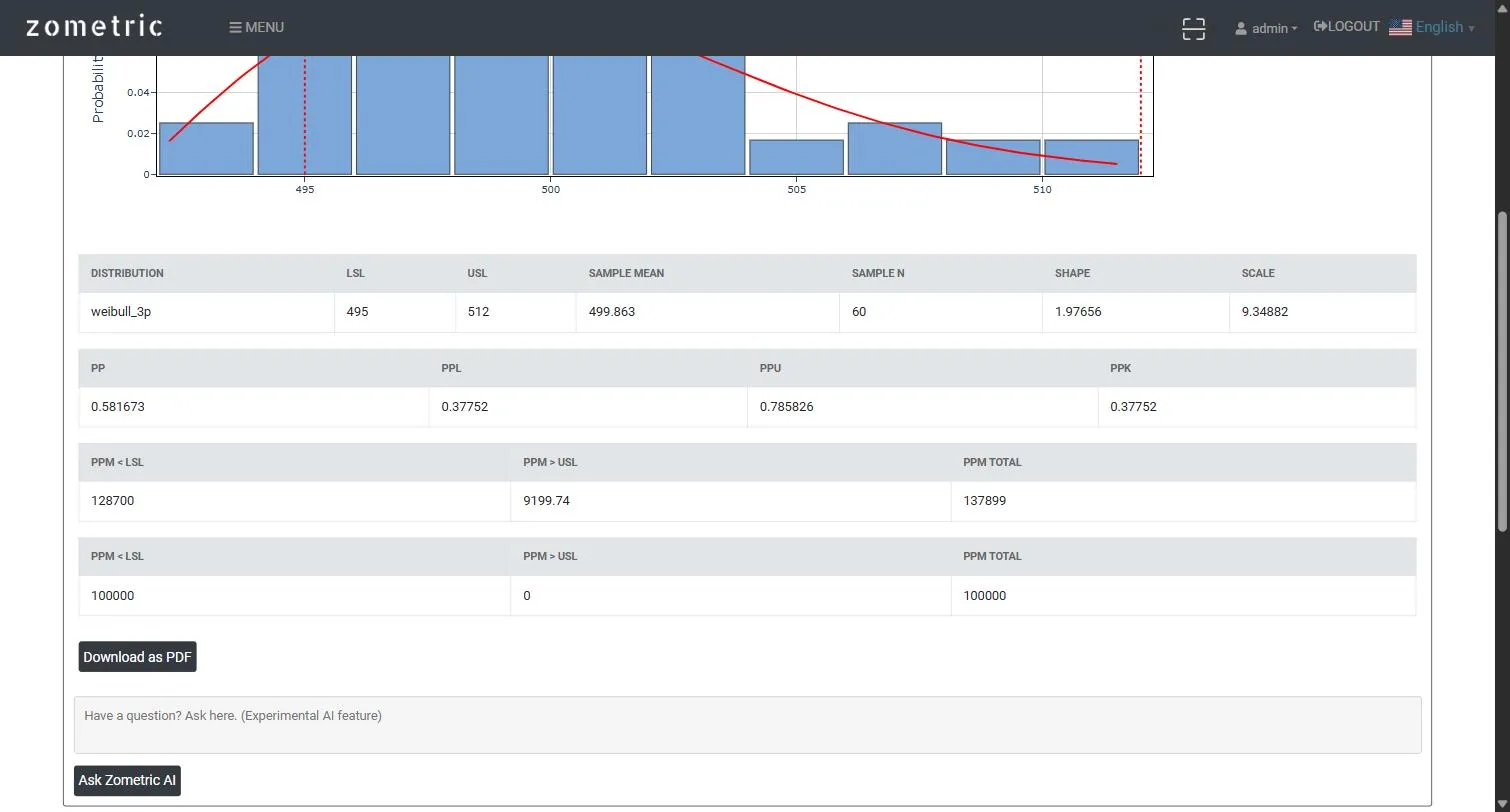
Figure 3 — Automated routing decision (Anderson-Darling result and path taken) with the fitted-distribution histogram.
Worked Example
A filling line fills bottles of a viscous cleaning liquid; fill weight (g) is measured on 60 bottles pulled across a shift (column C1), with LSL = 495 g and USL = 512 g. With the default 0.1 threshold, the Anderson-Darling test returns AD = 0.6630, P = 0.0794 — below the threshold — so the tool automatically routes to the Nonnormal path and selects a 3-Parameter Weibull fit (AD = 0.1799, P = 0.9164) as the best-fitting distribution, reporting Ppk = 0.378 from the fitted Weibull's tail probabilities rather than from a (misleading) Normal-distribution assumption.