
Between/Within Process Capability
On this page
Purpose
Between/Within Process Capability produces a single capability report that separates the two sources of variation present in any subgrouped process — variation BETWEEN subgroups (shift-to-shift or hour-to-hour drift) and variation WITHIN a subgroup (short-term machine/measurement noise) — and reports both a within-subgroup capability (Cp/Cpk family) and an overall/total capability (Pp/Ppk family) side by side. It is the standalone equivalent of the “Between/Within” panel inside a full capability sixpack, for users who want just the indices and histogram without the accompanying control charts.
Key Capabilities
- Accepts either several replicate columns (one column per replicate reading within a subgroup) or a single response column with an explicit subgroup size.
- Optional Factor column to compare capability across named groups (e.g. machine, line) from a single Response + Factor layout.
- Optional “Compare selected columns as separate groups” mode to run several columns as independent processes instead of pooling them.
- Computes both Within-subgroup (Cp/Cpk) and Overall (Pp/Ppk) capability from the same dataset, plus Cpm when a target is supplied.
- Configurable K-sigma tolerance multiplier and moving-range-based sigma estimation, consistent with the app's other capability tools.
Statistical Methods
The tool estimates three standard deviations from the subgrouped data. σ_within is a pooled short-term estimate across all subgroups (for subgroup size 1, the mean-moving-range estimate MRbar/1.128; for larger subgroups, a pooled-standard-deviation estimate across subgroups). σ_xbar is estimated from the moving range of the subgroup means (MRbar/d2, or a median-moving-range variant), and σ_between is then backed out as σ_between = √(max(0, σ_xbar² − σ_within²/n)), where n is the subgroup size. Combining these gives σ_between_within = √(σ_between² + σ_within²) — the “Potential” (within + between) capability sigma. Separately, σ_overall is the ordinary sample standard deviation computed directly across all individual observations around the grand mean — the “Performance” sigma.
The “Potential” indices are computed against σ_between_within: Cp = (USL − LSL) / (K·σ_between_within), Cpu = (USL − x̄) / ((K/2)·σ_between_within), Cpl = (x̄ − LSL) / ((K/2)·σ_between_within), and Cpk = min(Cpu, Cpl), using the default K = 6 (6-sigma) tolerance convention.
The “Performance” indices (Pp, Ppu, Ppl, Ppk) use the identical formulas with σ_overall in place of σ_between_within — matching standard SQC terminology (Montgomery, Introduction to Statistical Quality Control) while this tool's own between/within decomposition feeds both.
CCpk uses the pure within-subgroup sigma alone: CCpk = min[(USL−x̄)/((K/2)·σ_within), (x̄−LSL)/((K/2)·σ_within)] — a “combined capability” index that ignores between-subgroup drift entirely, useful for isolating pure short-term machine capability from the report's other indices.
When a Target is supplied, Cpm is additionally reported: Cpm = (USL − LSL) / (K·√(mean((x−Target)²))), using the mean squared deviation from target across all individual observations, which penalizes the index for a process mean that is off-target even if it is otherwise well within spec.
Z.LSL and Z.USL (both Within and Overall) report the standardized distance between the process mean and each spec limit, and PPM figures combine the fitted Normal distribution's expected tail probability beyond each spec limit with the actual observed out-of-spec count from the raw data.
Input Fields & Options
Field | Description |
|---|---|
Subgroup Columns | Select 2 or more replicate columns (each holding one replicate reading within the same subgroup), OR a single column combined with an explicit Subgroup size below. |
LSL / USL | Lower and upper specification limits for the response. |
Target | Optional. When supplied, adds the Cpm index to the report. |
Subgroup size | Required only when a single Subgroup Column is selected, or when “Compare selected columns as separate groups” is checked. Leave blank when multiple replicate columns are selected. |
Factor | Optional. Compare capability across named groups when the data is a single Response column plus a Factor column (one row per reading). Requires a single Subgroup Column. |
Compare selected columns as separate groups | When 2+ Subgroup Columns are selected, run capability separately for each column and compare side-by-side instead of pooling them into one process. |
SD estimation method | How the within-subgroup short-term sigma is estimated — default “Average moving range.” |
Length of moving range | Span of the moving range used for the SD estimate; default 2. |
Tolerance (K) | Multiplier applied to sigma when forming the capability tolerance band; default 6 (standard 6-sigma capability). |
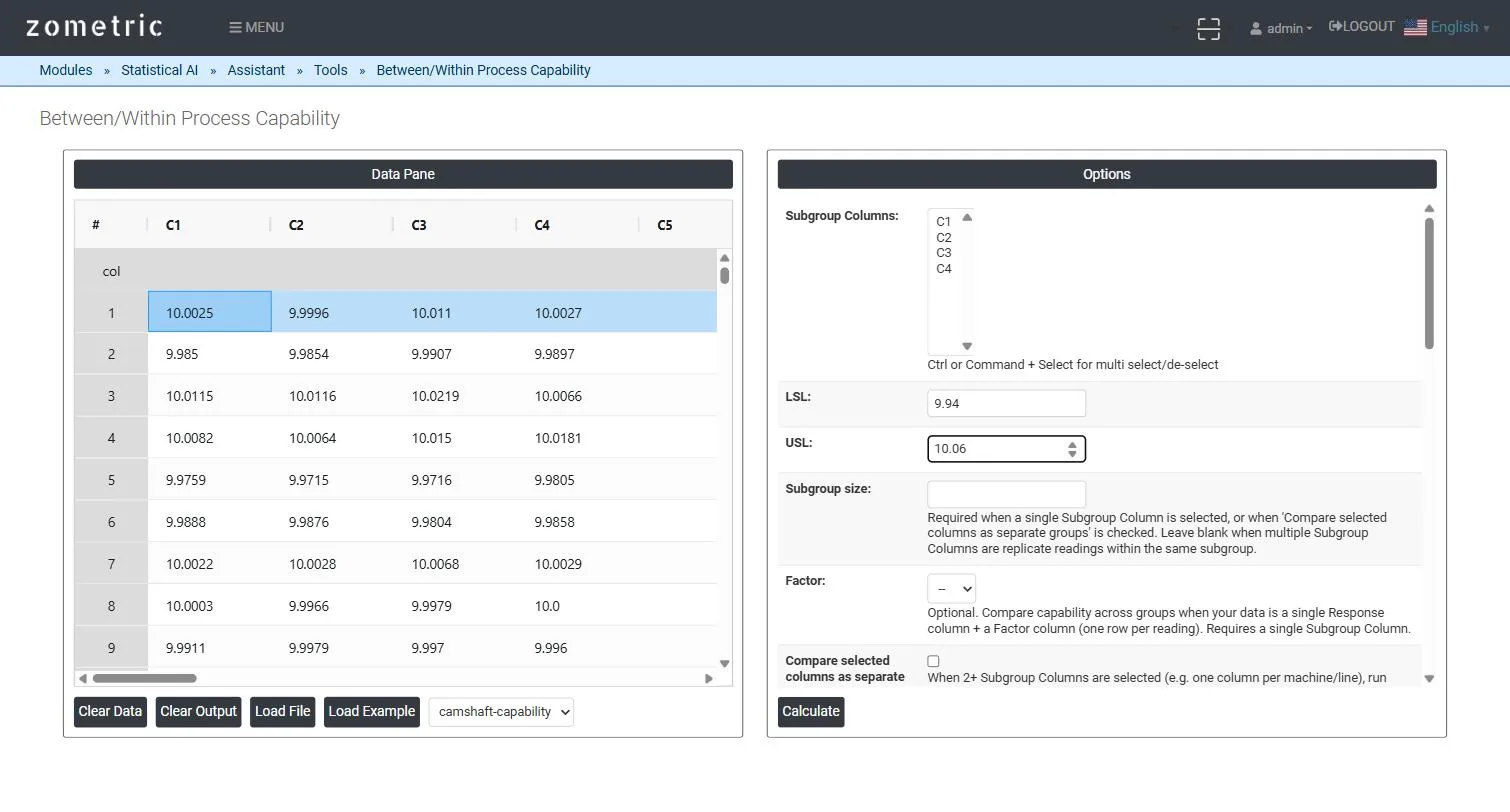
Figure 1 — Data pane loaded with 20 subgroups of 4 replicate diameter readings, and the Options panel with Subgroup Columns C1–C4 selected, LSL/USL/Target filled in.
Output Descriptions
- Field summary table — the LSL, Target and USL used for the run.
- Potential (Within) indices — StDev Within, Cp, Cpl, Cpu, Cpk, CCpk, Z.LSL Within, Z.USL Within.
- Performance (Overall) indices — StDev Overall (labeled StDev B/W), Pp, Ppl, Ppu, Ppk, Cpm, Z.LSL Overall, Z.USL Overall.
- Histogram — the pooled response distribution with LSL/Target/USL reference lines and a fitted Normal density curve overlaid.
- PDF export of the full report via the Download as PDF button.
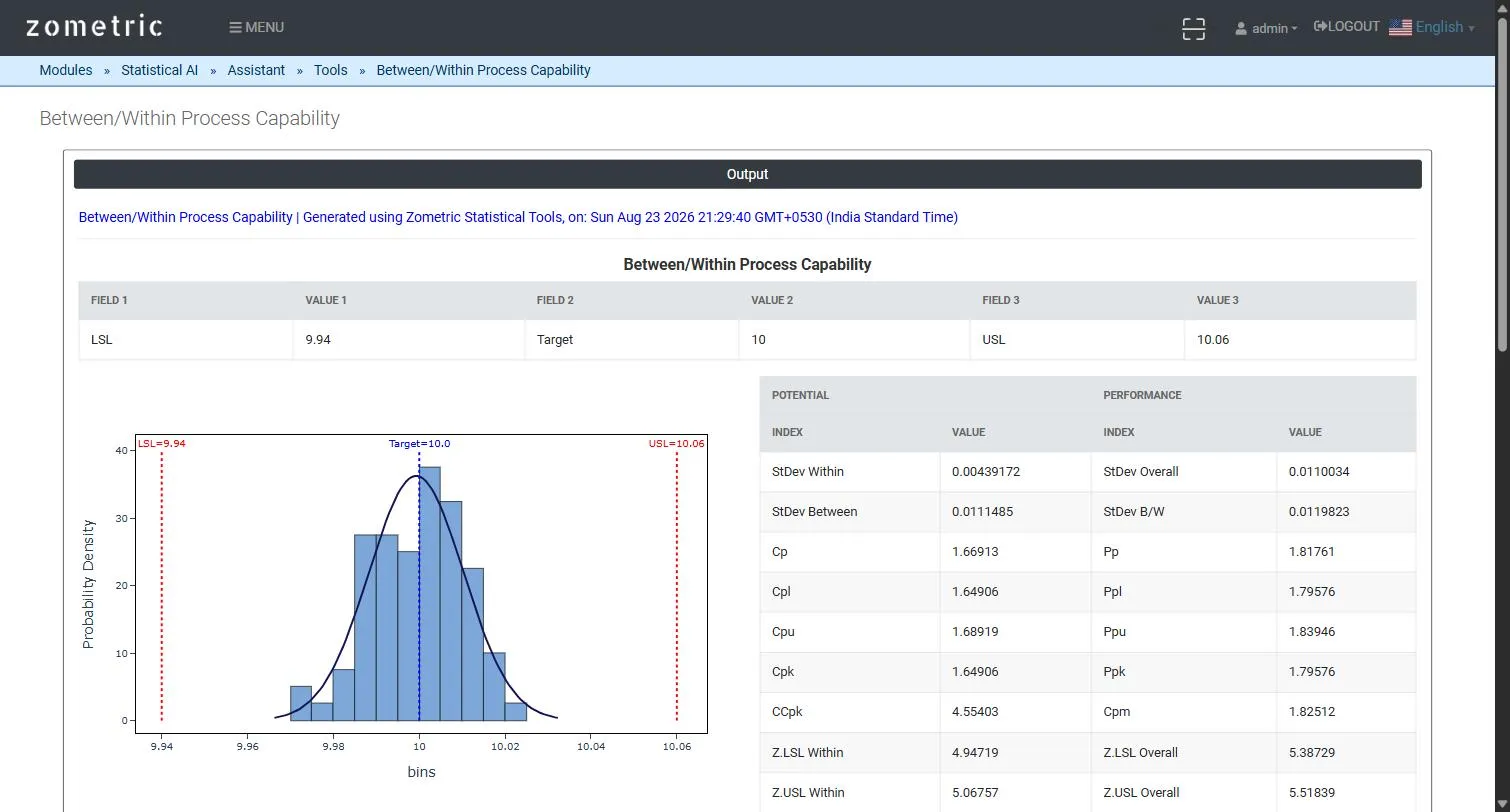
Figure 2 — Output report: capability histogram with LSL/Target/USL reference lines and fitted Normal curve, alongside the Within (“Potential”) and Overall (“Performance”) capability index tables.
Worked Example
A CNC line machines a shaft outer diameter (mm). Every hour an operator pulls 4 consecutive parts (a subgroup) and measures the diameter, giving 20 subgroups of 4 replicates over 20 hours (columns C1–C4). With LSL = 9.94, USL = 10.06 and Target = 10.00, the tool reports StDev Within ≈ 0.0044, StDev Overall ≈ 0.0110, Cpk ≈ 1.65 and Ppk ≈ 1.80 — the overall (total) spread is visibly wider than the within-hour spread, indicating most of the process variation comes from hour-to-hour drift rather than short-term machine noise, exactly the distinction this tool is built to surface.