
EMP Crossed (Evaluate Measurement Process)
On this page
Purpose
EMP Crossed evaluates a crossed Gauge R&R design (parts × operators × replicates) through the lens of Wheeler's EMP (Evaluating the Measurement Process) methodology, rather than the classical ANOVA-based %GRR / %Contribution / ndc report the app's Crossed GRR tool produces. Instead of comparing measurement variation to a tolerance, EMP Crossed reframes the same dataset around Intraclass Correlation (ICC) and assigns the measurement system a 1st–4th Class Monitor rating — a genuinely different measurement-system-evaluation philosophy, not a duplicate of the app's other crossed GRR or capability-comparison tools.
Key Capabilities
- Implements Wheeler's EMP methodology as an alternative lens on a standard crossed part/operator/replicate design, reporting Intraclass Correlation and a 4-tier classification instead of %GRR against a tolerance.
- Requires at least 2 replicate readings per part-operator combination (enforced — the tool errors out otherwise), so repeatability can be estimated directly from within-cell variation.
- Reports Test-Retest Error, Probable Error, both a bias-free and a bias-inclusive Intraclass Correlation, and a Bias Impact percentage, culminating in a 1st–4th Class Monitor classification.
- Produces 5 diagnostic charts in one report: a Repeatability (Range) chart split by operator, a Signal-vs-Noise chart, a Parallelism plot, and two Analysis-of-Means charts (on operator averages and on operator average ranges).
- Optional study-information fields (part number, gauge name/number, resolution, reported by, remarks, etc.) for report labeling, plus an Excel export bundling the EMP Statistics, ANOVA, options and raw data as 4 sheets.
Statistical Methods
The tool first runs the same two-way ANOVA with interaction used by the app's classical Crossed GRR tool — Part, Operator, Part×Operator interaction, Repeatability and Total, each with its own DF, SS, MS, F and P — giving the familiar significance tests for part-to-part, operator-to-operator and interaction effects before the EMP-specific statistics are derived from it.
Wheeler's variance components are then computed FROM THE REPEATABILITY (error) MEAN SQUARE, not the interaction mean square — a deliberate EMP simplification that differs from a full ANOVA-with-interaction GRR: σ²_e (repeatability) = MS_Repeatability; σ²_p (part) = max(0, (MS_Part − MS_Repeatability) / (operators × replicates)); σ²_op (reproducibility) = max(0, (MS_Operator − MS_Repeatability) / (parts × replicates)); total variance = σ²_p + σ²_op + σ²_e.
From these, the EMP Statistics table reports: Test-Retest Error = σ_e (the square root of σ²_e); Probable Error = 0.6745 × Test-Retest Error (Wheeler's classic “PE”, the median absolute deviation equivalent under Normality); Intraclass Correlation (no bias) = σ²_p / (σ²_p + σ²_e); Intraclass Correlation (with bias) = σ²_p / total variance — the statistic that drives the final classification; and Bias Impact (%) = σ²_op / total variance × 100.
The measurement system is classified from the bias-inclusive ICC: ≥0.80 = 1st Class Monitor, ≥0.50 = 2nd Class Monitor, ≥0.20 = 3rd Class Monitor, otherwise 4th Class Monitor — Wheeler's own published thresholds, applied directly.
The 5 chart specs: (1) Repeatability chart — a Range chart of part-within-operator ranges, one series per operator, with UCL = d4·R̄ and LCL = max(0, d3·R̄) from the standard SPC d3/d4 constants for the replicate count; (2) Signal-vs-Noise chart — each part's mean plotted against the grand mean with ±3·σ_e noise bands; (3) Parallelism plot — each operator's mean-by-part profile overlaid, to check operators rank parts consistently; (4) ANOM chart — operator averages against decision limits grand_mean ± t_crit·σ_e·√((operators−1)/(operators×parts×replicates)), with t_crit = t.ppf(1−alpha/2, df_repeatability); (5) ANOM-R chart — operator average ranges against the same d4/d3·R̄ UCL/LCL convention as chart 1, one point per operator.
LSL, USL, Historical Std Dev and Measurement Increment are accepted on the form and (when supplied) echoed into the report's Study Information block, but are not consumed by any EMP formula above — consistent with the same accepted-but-unused transparency this documentation applies elsewhere in the app.
Input Fields & Options
Field | Description |
Part | Required. The column identifying which part each reading belongs to. |
Operator | Required. The column identifying which operator took each reading. |
Measurement | Required. The numeric response column being evaluated. |
Alpha | Default 0.05 (range 0.001–0.5). Significance level used only by the ANOM and ANOM-R decision limits. |
LSL / USL | Optional. Echoed into the Study Information block; not used by any EMP calculation. |
Historical Std Dev | Optional. Echoed into the Study Information block; not used by any EMP calculation. |
Measurement Increment | Optional. Echoed into the Study Information block; not used by any EMP calculation. |
Download as Excel | Optional. Exports EMP Statistics, ANOVA, options and raw data as a 4-sheet workbook. |
Study Information (Optional — report labeling only)
Field | Description |
Report Title / Company Name / Customer Name | Optional labels shown at the top of the rendered report. |
Date of Study | Optional date field. |
Part number: / Part name: / Characteristic: | Optional identifying labels for the part being studied. |
Gauge Name / Gauge Number / Gauge Resolution: | Optional identifying labels for the measurement instrument. |
Reported By / Remarks | Optional free-text fields. |
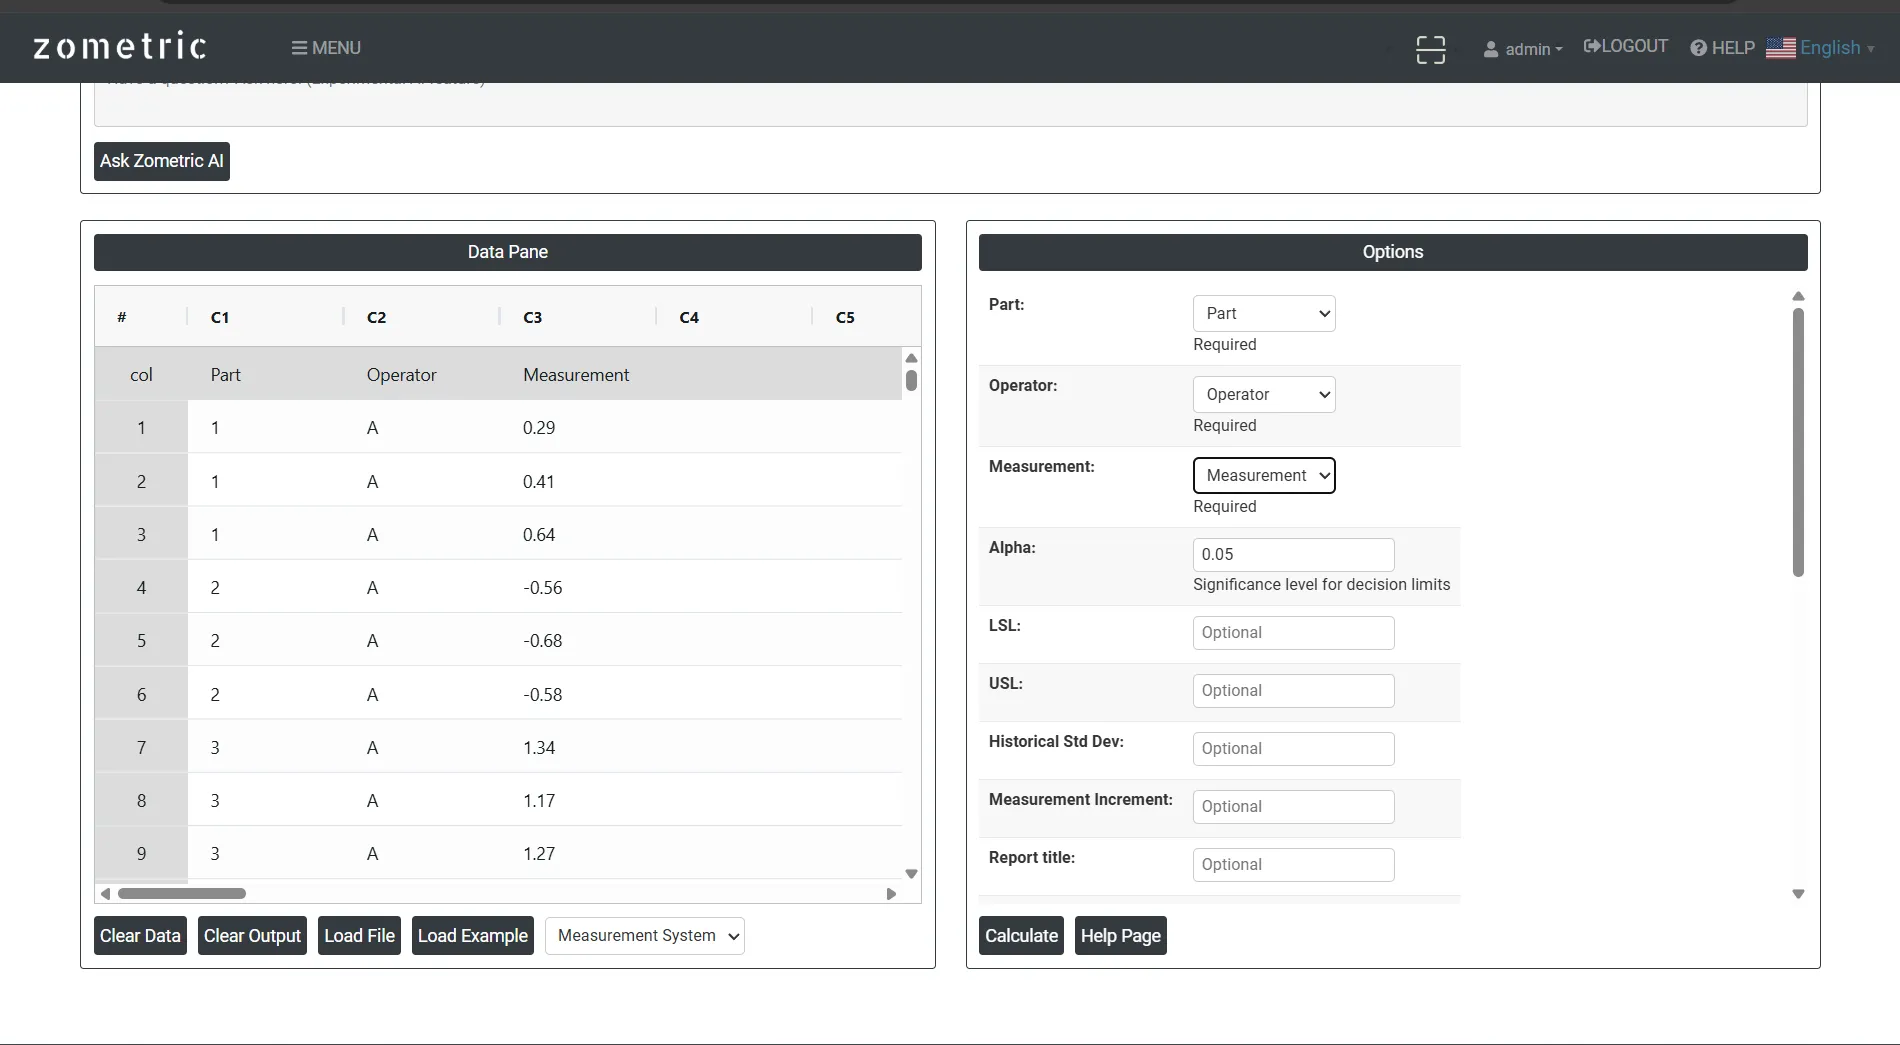
Figure 1 — Data pane loaded with the tool’s built-in “Measurement System” example (10 parts × 3 operators × 3 replicates, 90 rows) in Part/Operator/Measurement columns, mapped on the Options panel with Alpha at its 0.05 default.
Output Descriptions
- Study Information table (when any optional labeling field is supplied) — customer, part number/name, characteristic, gauge name/number/resolution, reported by, remarks, date of study, LSL/USL when supplied, and the list of operators in the dataset.
- EMP Statistics table — Test-Retest Error, Probable Error, Intraclass Correlation (no bias), Intraclass Correlation (with bias), Bias Impact (%), and the final Classification.
- Two-Way ANOVA table — DF, SS, MS, F and P for Part, Operator, Part×Operator interaction, Repeatability and Total.
- Signal-vs-Noise chart — part means plotted against the grand mean with ±3·σ_e noise bands, showing whether part-to-part differences (“signal”) are large relative to repeatability (“noise”).
- Parallelism plot — each operator's mean-by-part profile overlaid, to visually check that operators rank the parts consistently with one another.
- Repeatability (Range) chart — the part-within-operator range, split by operator, against UCL/LCL from the d4/d3·R̄ convention.
- ANOM chart — operator averages plotted against decision limits centered on the grand mean, flagging any operator whose average differs significantly from the others.
- ANOM-R chart — operator average ranges plotted against the same UCL/LCL convention as the Repeatability chart, one point per operator, flagging any operator whose repeatability differs significantly from the others.
- Optional Excel export (Download as Excel) with EMP Statistics, ANOVA, options and raw data as 4 separate sheets.
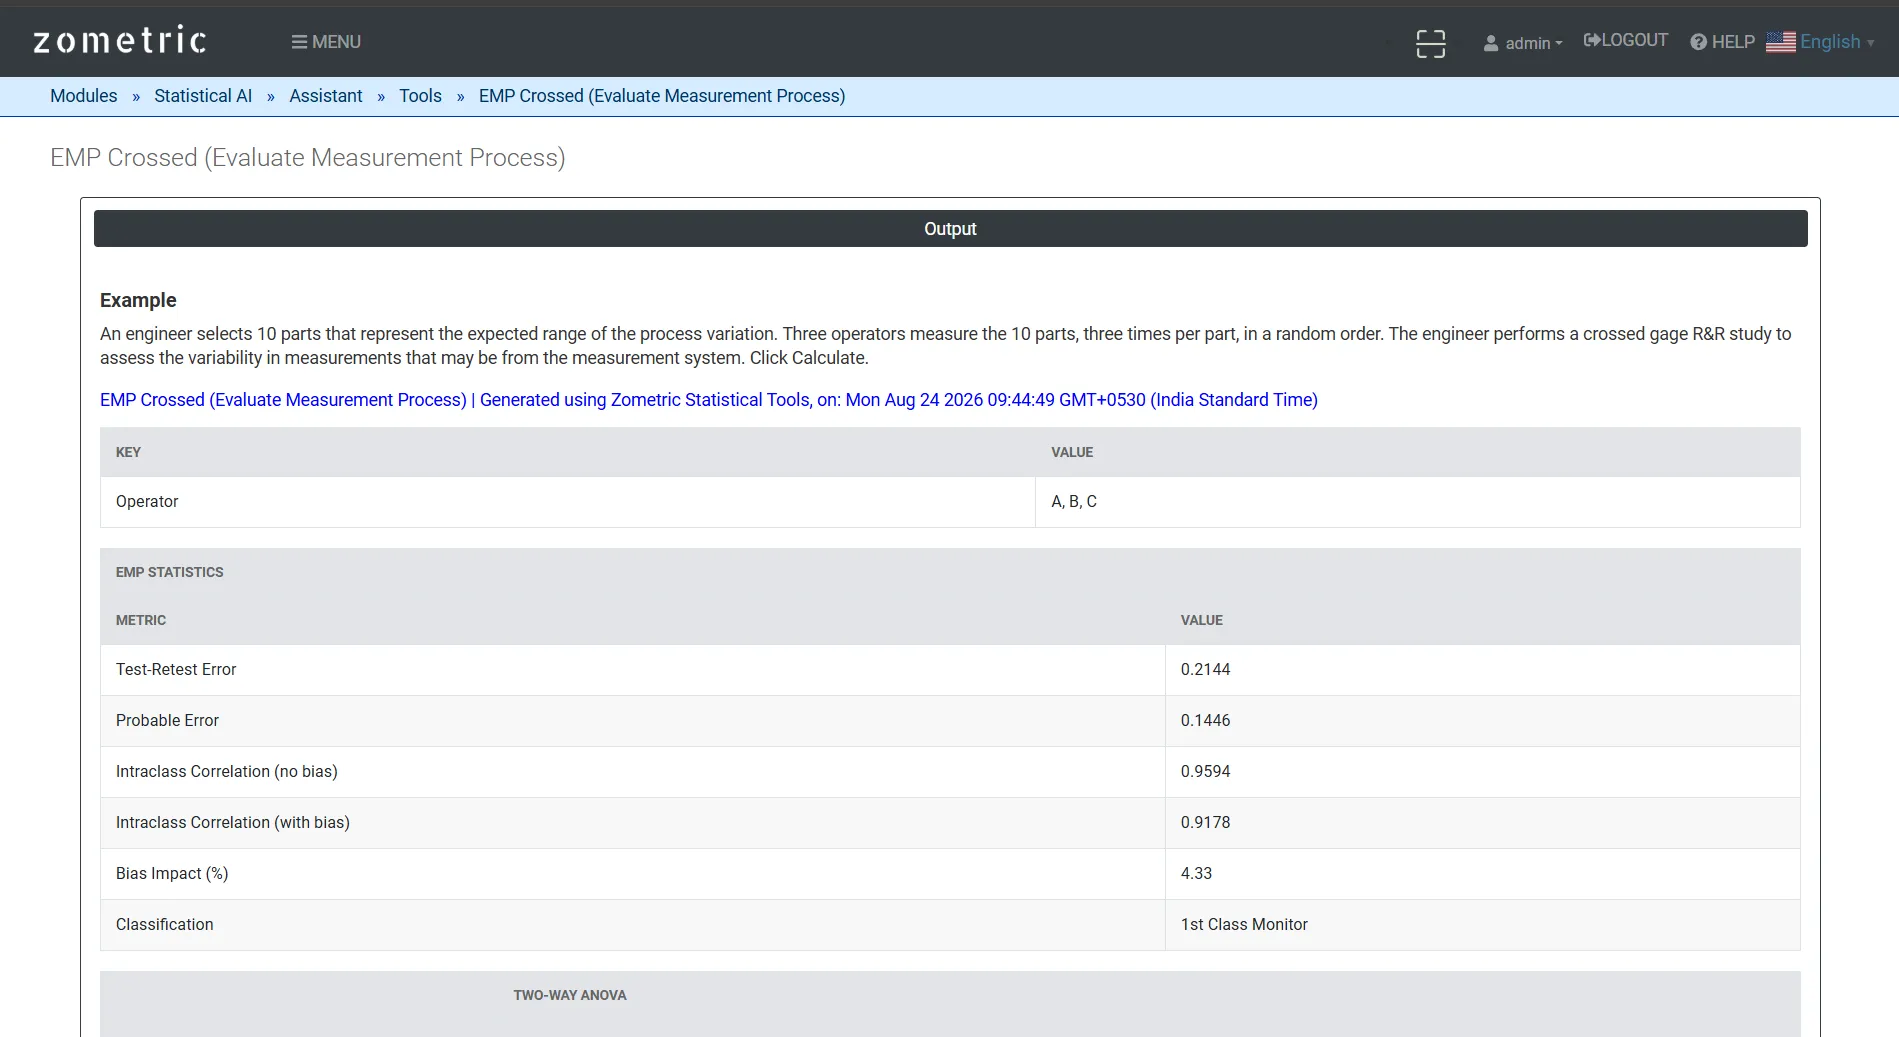
Figure 2 — The EMP Statistics table (Test-Retest Error, Probable Error, both Intraclass Correlations, Bias Impact % and Classification) and the Two-Way ANOVA table.
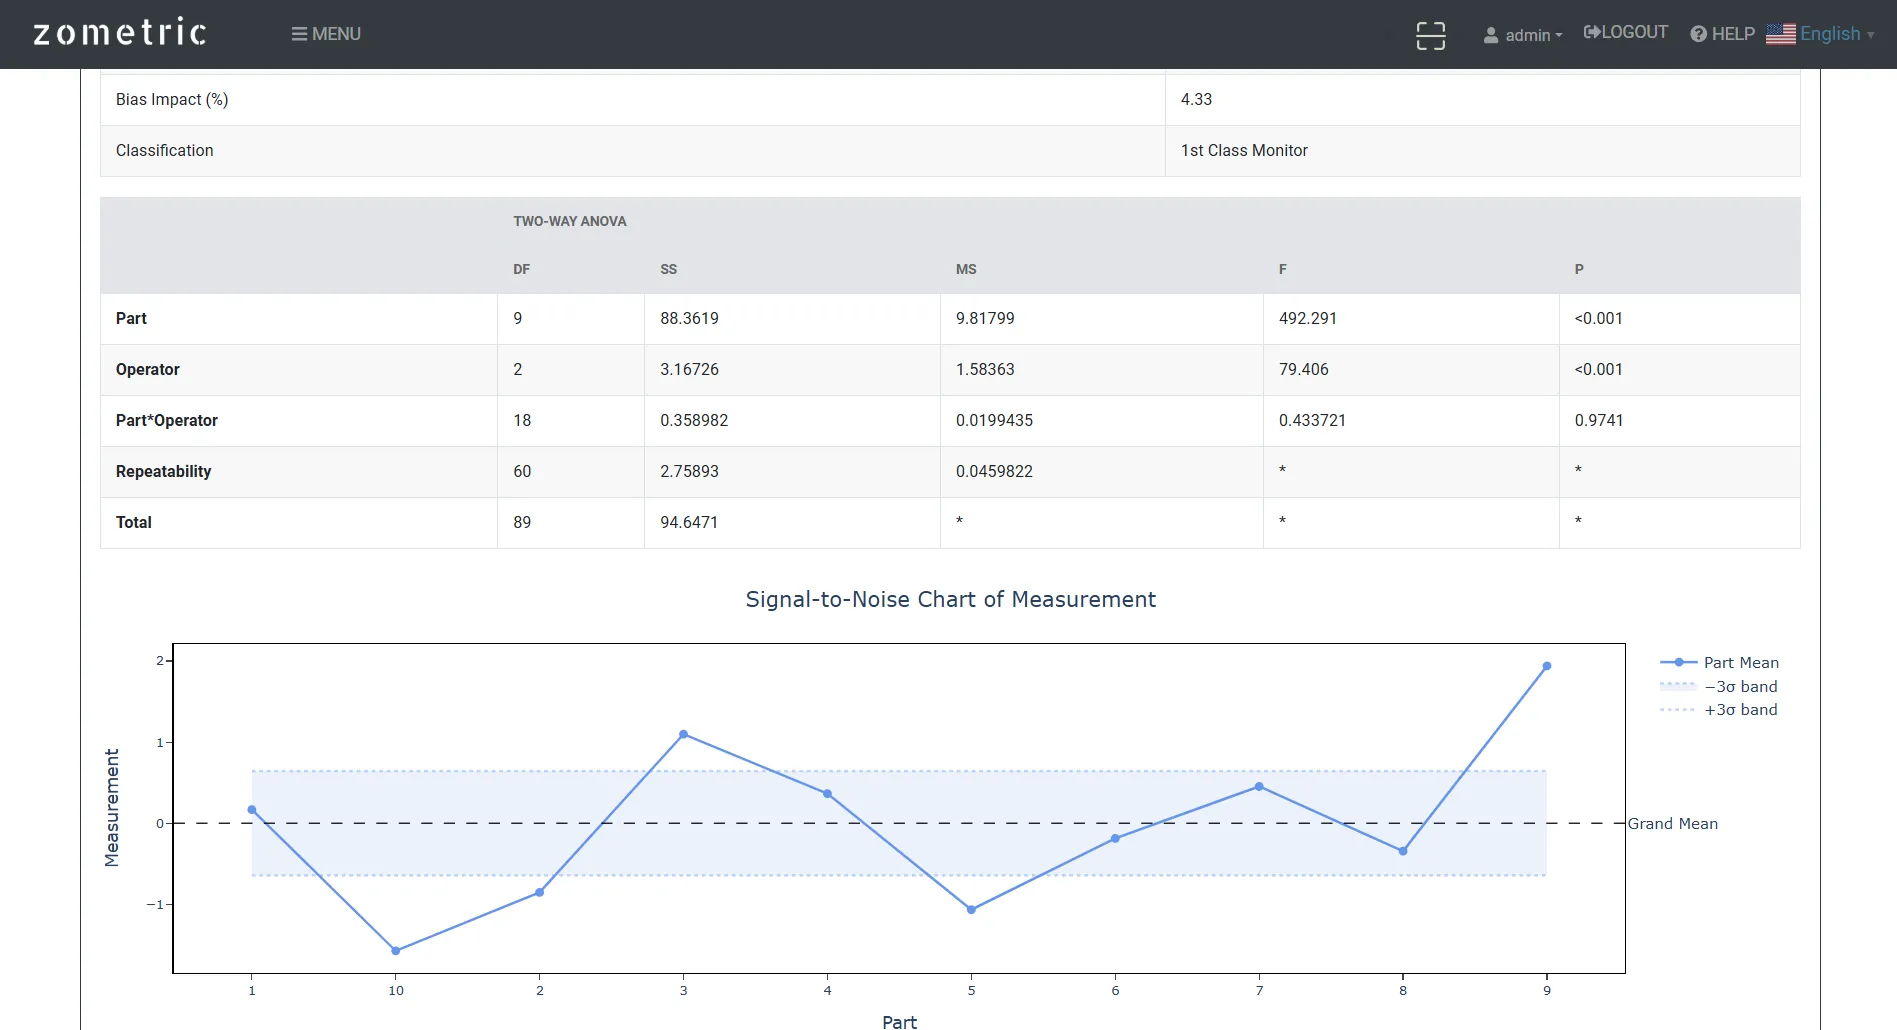
Figure 3 — Signal-vs-Noise chart: the 10 part means plotted against the grand mean with ±3·σ_e noise bands, showing the part-to-part signal is large relative to repeatability noise.
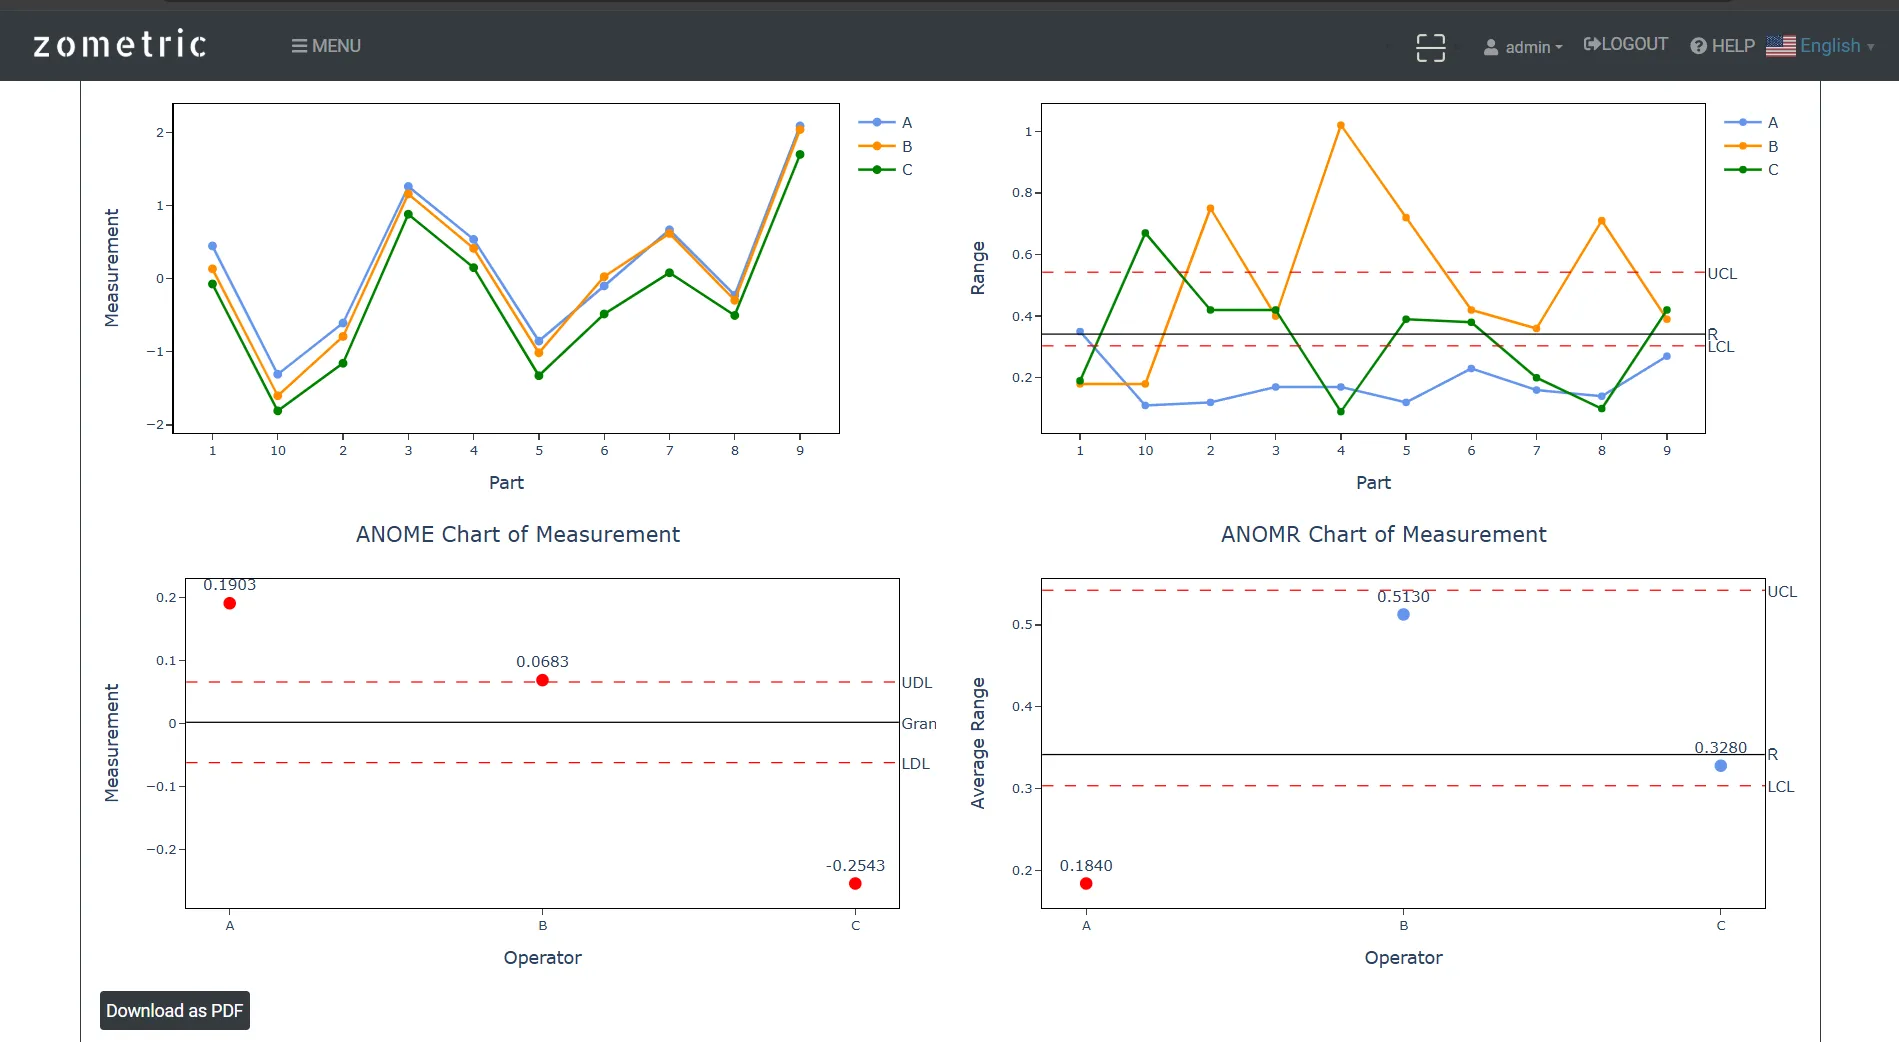
Figure 4 — Parallelism plot, Repeatability (Range) chart, ANOM chart and ANOM-R chart, each split or plotted by operator (A, B, C).
Worked Example
Using the tool's built-in “Measurement System” example dataset — a coordinate-measurement gauge study recording the deviation from nominal on 10 parts, measured by 3 operators (A, B, C) with 3 replicate readings each (90 readings total) — at the default Alpha = 0.05, the Two-Way ANOVA shows a highly significant Part effect (F ≈ 492.3, P ≈ 0.000) and a significant Operator effect (F ≈ 79.4, P ≈ 0.000), with no meaningful Part×Operator interaction (F ≈ 0.43, P ≈ 0.974). The EMP Statistics table reports Test-Retest Error ≈ 0.2144, Probable Error ≈ 0.1446, Intraclass Correlation (no bias) ≈ 0.9594, Intraclass Correlation (with bias) ≈ 0.9178, and Bias Impact ≈ 4.33% — clearing the 0.80 threshold for a 1st Class Monitor classification, meaning part-to-part variation (the real signal the gauge needs to detect) heavily dominates both repeatability noise and the small operator-to-operator bias.