
Group Chart (Multiple-Stream Process)
Purpose
A Group Chart monitors a multiple-stream process — several parallel, nominally identical streams producing output at the same time (e.g. cavities of a multi-cavity mold, filler heads on a bottling line) — by pooling all streams into one baseline and, each time period, plotting only the maximum and minimum reading across all streams, labeled with which stream produced them. If both extremes stay inside the limits, every stream is in control that period; the chart additionally flags a stream that is repeatedly the max or min without ever formally breaching a limit, meaning it has drifted chronically off from its peers.
Key Capabilities
- Monitors any number of parallel streams (2 or more) with one pooled chart instead of one chart per stream.
- Plots only the Stream Maximum and Stream Minimum per period, each point labeled with the source stream, so both extreme-value detection and a hover-visible “which stream” readout are available at once.
- Automatically derives a runs-detection threshold (how many consecutive periods the same stream can be the max/min before it's flagged as chronically off-target) from the number of streams and the chosen alpha, rather than using an arbitrary fixed number.
- Full Nelson's-rules special-cause detection (4 configurable rules) on both the max and min series.
- Configurable SD-estimation method and moving-range length, consistent with the app's other control charts.
Statistical Methods
The grand mean and pooled sigma are estimated across ALL streams together (not per-stream), using the app's standard moving-range-based sigma convention: for each period, the moving range is computed across consecutive pooled readings (with the configured moving-range length, default 2), and sigma is estimated as MRbar / d2. This pooled baseline is what makes it valid to compare all streams against one shared set of limits.
Each period, the maximum and minimum readings across all streams are extracted (Stream Maximum and Stream Minimum), each retaining a label identifying which stream produced it. Both series are then plotted as ordinary Individuals-style charts with UCL/CL/LCL = grand mean ± 3·sigma, reusing the app's existing subgroup-chart rendering and rule-checking machinery.
The chronic-drift “runs” threshold K is derived directly from the number of streams m and the chosen alpha, using Nelson's (1986) runs criterion: K = ceil( log(alpha) / log(1/m) ), the smallest number of consecutive periods that the same stream must be the max (or min) before that pattern is itself statistically unlikely to occur by chance at the target false-alarm rate, given m equally likely streams. With the default alpha = 0.0027 and m = 3 streams, this evaluates to K = 6 — i.e. one stream being the maximum for 6 consecutive periods is flagged even if none of those 6 individual points ever breaches the UCL on its own.
Rules 1–4 (Nelson's rules) are additionally evaluated on both the Stream Maximum and Stream Minimum series using the app's standard rule-checking logic, so an isolated extreme value, a run on one side of center, a sustained trend, or an alternating pattern are all still caught in the usual way, on top of the derived runs-based chronic-drift signal.
Input Fields & Options
Field | Description |
Streams | Required. Select 2 or more columns, one per parallel stream (e.g. one column per mold cavity or filler head) — each row is one time period with one reading from every stream. |
SD estimation method / Length of moving range | How the pooled sigma is estimated; default Average moving range, span 2. |
Alpha (stream-runs false alarm rate) | Default 0.0027. Sets how many consecutive periods the same stream must be the max (or min) before it's flagged as chronically off-target (Nelson's 1986 runs criterion). |
Check Rule 1–4 / K for Rule 1–4 | The four Nelson special-cause rules, applied to both the Stream Maximum and Stream Minimum series (defaults K = 3, 9, 6, 14). |
Include or Exclude / Specify which rows / Row numbers | Controls which time periods are plotted. |
Specify subgroups to estimate parameters / Subgroups | Optionally restricts which periods are used to estimate the pooled grand mean and sigma, while still plotting all periods. |
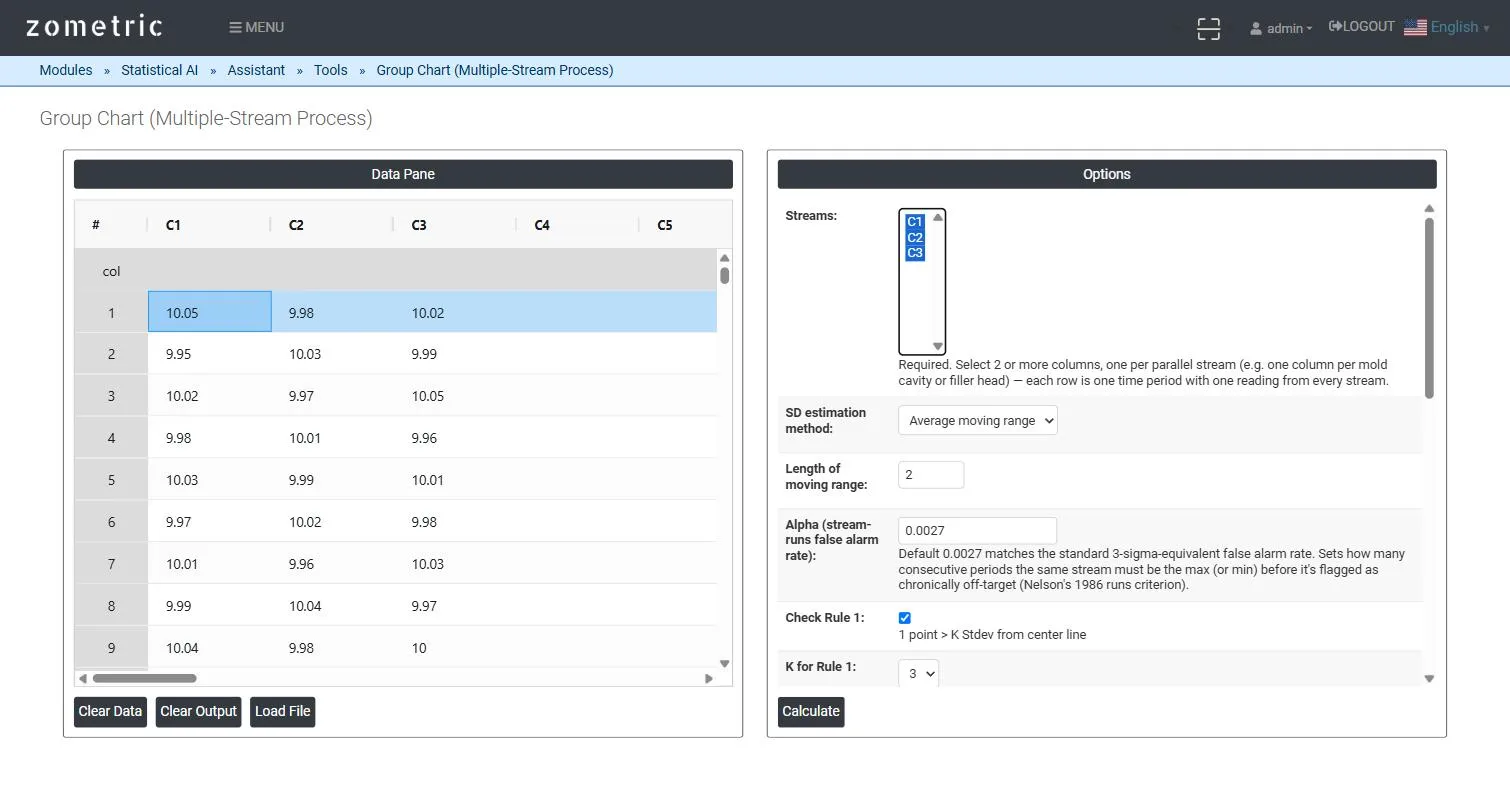
Figure 1 — 15 shifts of bore-diameter readings from 3 cavities (C1–C3) pasted into the grid, all three selected as Streams.
Output Descriptions
- Stream Maximum chart — the maximum reading across all streams each period, labeled by source stream, with UCL/CL/LCL and any Rule violations flagged.
- Stream Minimum chart — the minimum reading across all streams each period, labeled by source stream, with its own UCL/CL/LCL and Rule violations.
- Runs-flag detection — a stream that is repeatedly the max or min for at least K consecutive periods (derived from alpha and the number of streams) is identified as chronically off-target, even without individually breaching a limit.
- Grand mean, pooled sigma, and the derived runs-threshold K reported alongside the charts.
- PDF export via Download as PDF.
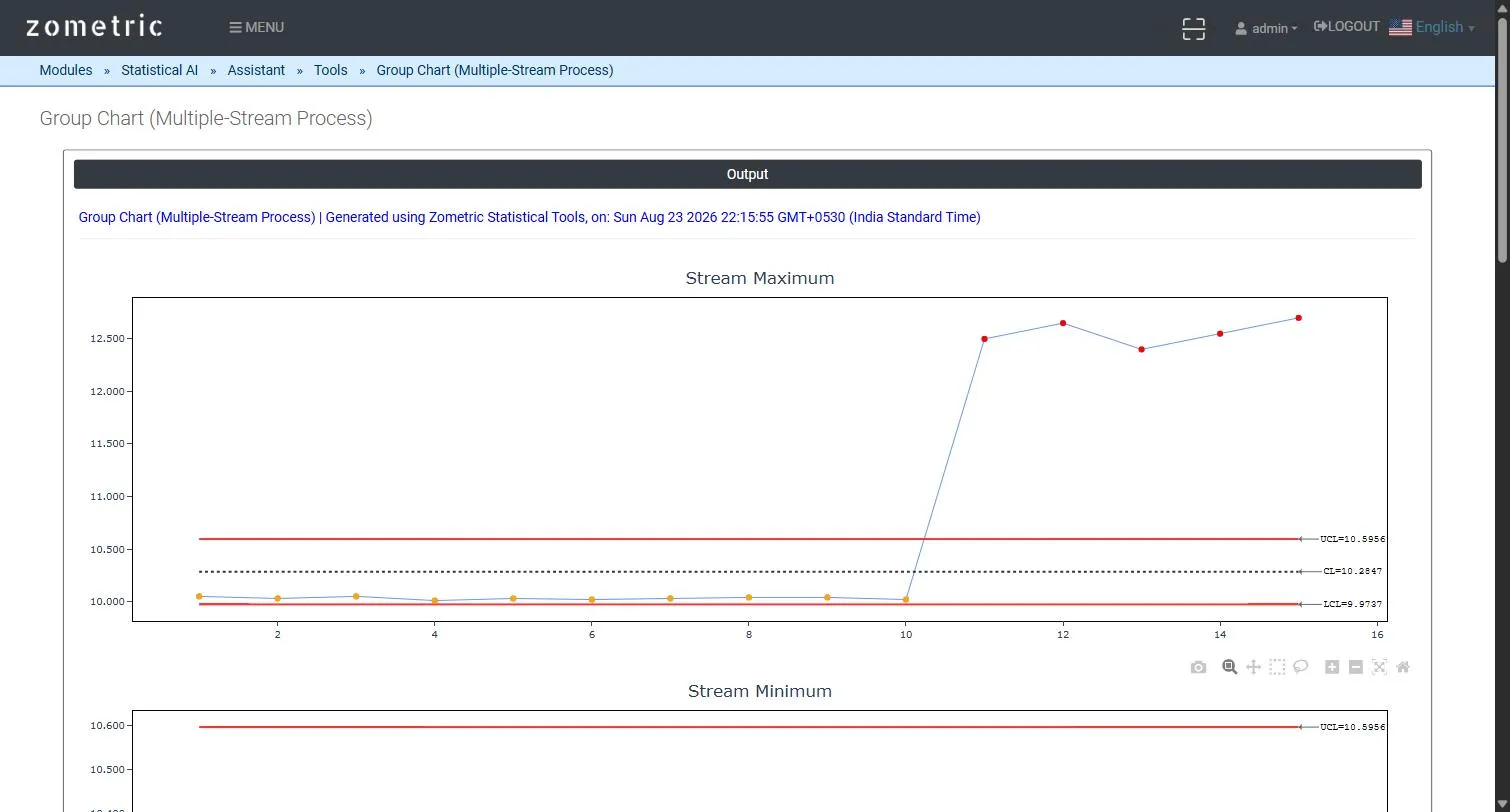
Figure 2 — The Stream Maximum panel: Cavity 1’s readings flagged in red from shift 11 onward, where it began drifting high relative to Cavities 2 and 3.
Worked Example
An injection-molding tool has 3 parallel cavities producing the same part, with one bore-diameter reading (mm) taken from each cavity every shift for 15 shifts (C1 = Cavity 1, C2 = Cavity 2, C3 = Cavity 3). Cavity 1 is built to drift high starting at shift 11 in the demo dataset. With all three columns selected as Streams and the default alpha = 0.0027 (giving K = 6 for m = 3 streams), the pooled grand mean comes out to ≈ 10.275 with sigma ≈ 0.0046 and UCL ≈ 10.29 on the Stream Maximum panel; from shift 11 onward, Cavity 1's readings are individually flagged red under Rule 1 for exceeding the UCL — a clear, immediate signal that Cavity 1 (likely from a partially clogged gate) needs attention, distinct from Cavities 2 and 3, which remain in control throughout.