
MEWMA Chart (Multivariate EWMA)
On this page
Purpose
A MEWMA (Multivariate Exponentially Weighted Moving Average) chart is the multivariate counterpart to the app's univariate EWMA chart, and the small-sustained-shift counterpart to the Hotelling T² chart: where a T² chart reacts to each new observation independently, a MEWMA chart smooths several correlated variables together across observations, making it substantially more sensitive to a small but sustained drift in the joint process (e.g. a slowly fouling catalyst affecting two related quality measurements together) than an unsmoothed T² chart would be.
Key Capabilities
- Smooths two or more correlated variables jointly using a single, tunable weighting constant (lambda).
- Detects small, sustained multivariate shifts substantially faster than the unsmoothed Hotelling T² chart, at the cost of slightly slower reaction to a single large, isolated shift.
- Configurable alpha (false-alarm rate), defaulting to the app-wide 0.0027 convention.
- Row inclusion/exclusion and a separate “estimate observations to estimate parameters” selector to baseline the mean vector and covariance matrix on a known-stable period.
Statistical Methods
Let x_i be the vector of the selected variables at observation i, and x̄ the estimated in-control mean vector (estimated from all rows, or from a specified baseline subset). The MEWMA smoothing vector is updated recursively over every observation in order: Z_i = λ·(x_i − x̄) + (1 − λ)·Z_{i−1}, with Z_0 = 0, where λ (the Weight field) is the smoothing constant, 0 < λ ≤ 1. Smaller λ values (e.g. the default 0.1) weight more historical observations into each smoothed point, making the chart more sensitive to small sustained shifts; larger λ values weight recent observations more heavily and cause the chart to behave increasingly like an unsmoothed Hotelling T² chart.
Because the smoothing vector's own covariance shrinks as more observations accumulate, its exact time-varying covariance is used rather than a fixed one: Σ_Zi = [λ/(2−λ)]·[1 − (1−λ)^(2i)]·Σ, where Σ is the sample covariance matrix of the variables (the standard closed-form result for MEWMA, Lowry, Woodall, Champ & Rigdon, 1992). The plotted statistic is then T²_i = Z_i′ Σ_Zi⁻¹ Z_i.
The upper control limit uses the standard chi-square approximation, the conventional practical choice in the absence of ARL-optimized simulated tables: UCL = chi2.ppf(1 − alpha, p), with the default alpha = 0.0027. As with the Hotelling T² chart, only Rule 1 (a point exceeding the UCL) is evaluated, since this is a one-sided, non-Normal distance statistic.
Input Fields & Options
Field | Description |
Variables | Required. Select 2 or more correlated variables measured on each observation. |
Weight (lambda) | Smoothing constant, 0 < lambda ≤ 1. Default 0.1. Smaller values detect small sustained shifts faster; larger values react more like an unsmoothed T² chart. |
Alpha (false alarm rate) | Default 0.0027, matching the standard 3-sigma-equivalent false alarm rate. |
X scale | Optional custom labeling for the observation axis. |
Include or Exclude / Specify which rows / Row numbers | Controls which rows are plotted. |
Specify observations to estimate parameters (mean vector & covariance matrix) / Observations | Optionally restricts which rows are used to estimate the baseline mean vector and covariance matrix, while still plotting all rows. |
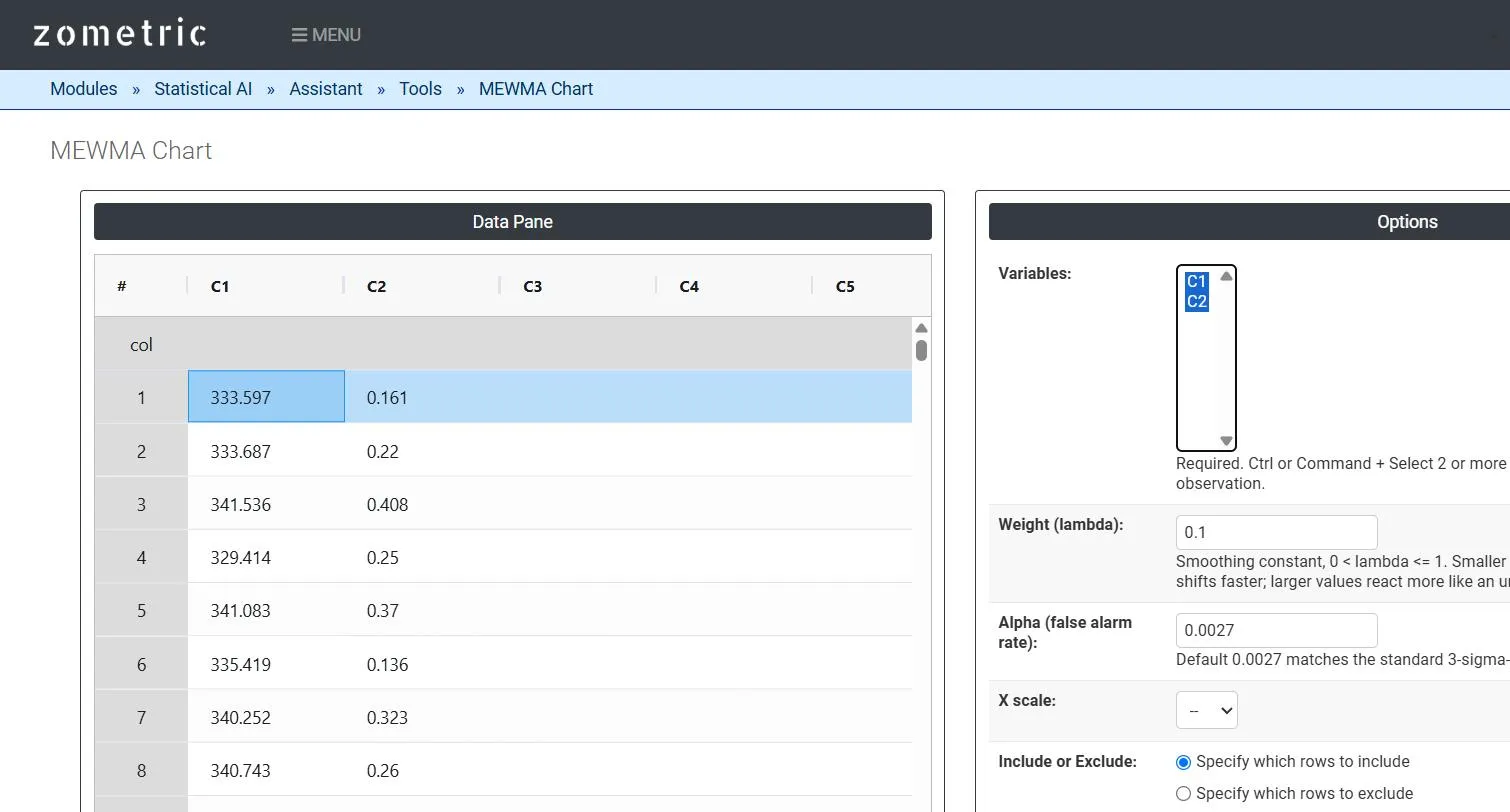
Figure 1 — 25 paired viscosity/monomer-% batch readings pasted into C1–C2, both selected as Variables, Weight (lambda) = 0.1.
Output Descriptions
- MEWMA Chart plot — the smoothed MEWMA T² statistic for each observation in time order, with UCL and (near-zero) LCL.
- Summary table — the variables used, p (number of variables), m (observations used to estimate parameters), Weight (lambda), Alpha and UCL.
- Nelson's Rules / Potential Special Cause Points — which points (if any) exceeded the control limit.
- PDF export via Download as PDF.
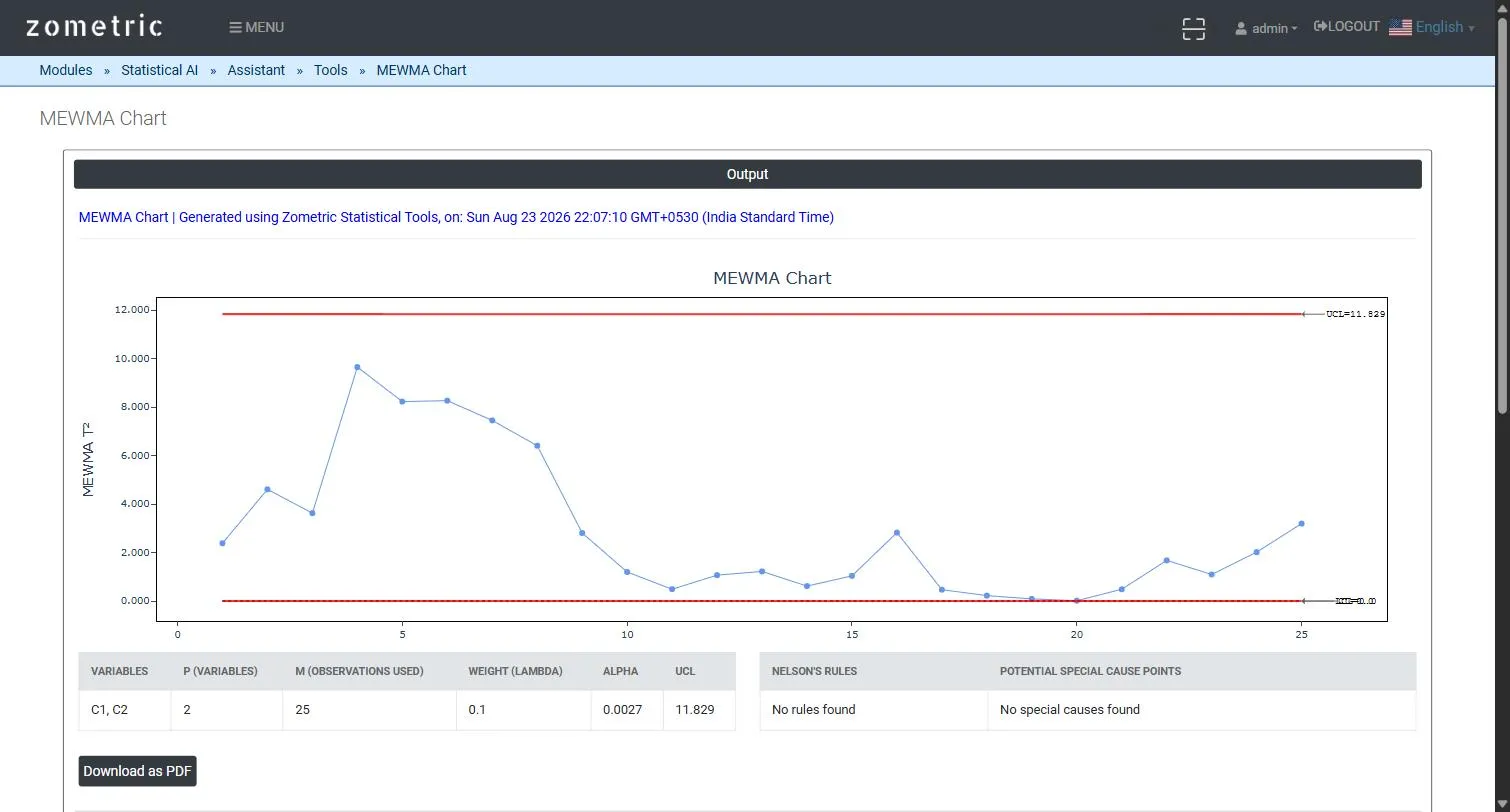
Figure 2 — MEWMA Chart output: the smoothed MEWMA T² statistic per batch with UCL, and the Variables/p/m/Weight/Alpha/UCL summary table.
Worked Example
A batch reactor's product quality depends jointly on final viscosity (C1, cP) and residual monomer % (C2), which drift together as a catalyst slowly fouls across 25 consecutive batches. With Weight (lambda) = 0.1 and Alpha = 0.0027, the smoothed MEWMA T² statistic climbs steadily from batch 1 through roughly batch 4–5 (reaching ≈ 9.7 against a UCL of ≈ 11.8) as the built-in slow drift accumulates in the smoothed statistic, then relaxes back down — exactly the kind of small, sustained, jointly-correlated shift a MEWMA chart is built to surface earlier than an unsmoothed T² chart would.