
2x2 Crossover Design
On this page
Purpose
2x2 Crossover Design tests whether a test treatment is equivalent to a reference treatment when each subject receives both, one in each of two periods, in one of two orders. Subjects can be people, machines, furnaces or test rigs. Because every subject is compared with itself, differences between subjects drop out, and the design separates the treatment difference from any drift between the periods. Use it to show that a cheaper material, a new supplier or a changed method gives the same result as the current one, within limits you set.
Key Capabilities
- Equivalence test (two one-sided t-tests, TOST) of Mean(test) − Mean(reference) against lower and upper equivalence limits.
- Estimates and t-tests of the carryover, treatment and period effects.
- Data as one row per subject with a sequence column, or as four unstacked columns (sequences may differ in size).
- Limits as absolute differences or as fractions of the reference mean.
- Descriptive statistics by sequence and period, the within-subject standard deviation and an equivalence plot.
- Data Options: subset the rows before the analysis.
Statistical Methods
Sequence 1 receives the treatments in the order you set (Test, Reference or Reference, Test) and sequence 2 in the opposite order. For each subject the tool computes the period difference d = Period 1 − Period 2 and the sum u = Period 1 + Period 2. With n₁ and n₂ subjects in the two sequences and v = n₁ + n₂ − 2 degrees of freedom: treatment effect = ±(mean d₁ − mean d₂)/2, period effect (Period 2 − Period 1) = −(mean d₁ + mean d₂)/2, carryover = mean u₁ − mean u₂. Their standard errors use the pooled standard deviations of d and u times √(1/n₁ + 1/n₂) (divided by 2 for the treatment and period effects). This follows Chow and Liu's analysis of 2×2 crossover studies.
Equivalence is tested with two one-sided t-tests: H₀₁: difference ≤ lower limit and H₀₂: difference ≥ upper limit, each at level α. Equivalence is claimed when both are rejected, that is when the larger p-value is below α. The matching interval is the 100(1 − 2α)% confidence interval of the difference, extended to include the midpoint of the limits; equivalence is claimed when it lies inside the equivalence interval. With α = 0.05 this is the usual 90% TOST interval.
The carryover test checks whether the first treatment's effect lasts into the second period; if it is significant, the treatment comparison is biased and only the first period can be trusted. The period effect captures drift such as tool wear or season, which the crossover keeps out of the treatment estimate. Within-subject standard deviation = pooled SD of d / (2√2).
Input Fields & Options
Field | Description |
Data | Sequence column with Period 1 and Period 2 columns (default), or Data for two sequences are unstacked. |
Sequence column / Label of sequence 1 | Column labelling each subject's sequence, and the value in it that marks sequence 1; all other values are sequence 2. |
Period 1 response / Period 2 response | Columns with each subject's result in each period. |
Sequence 1, Period 1 / Sequence 1, Period 2 / Sequence 2, Period 1 / Sequence 2, Period 2 | Unstacked layout: the four result columns. |
Treatment order for sequence 1 | Test, Reference (default) or Reference, Test. |
Significance level (α) | Default 0.05, which gives the usual 90% two one-sided tests interval. |
Lower equivalence limit / Upper equivalence limit | The smallest and largest difference (test − reference) that still counts as equivalent. |
Multiply by reference mean | Treat the limits as fractions of the sample reference mean (e.g. −0.05 and 0.05 for ±5%). |
Label for test treatment / Label for reference treatment | Names used in the output; defaults Test and Reference. |
Equivalence plot | Ticked by default. |
Data Options: Subset (optional) | Exclude matching rows (default) or Include only matching rows, by row numbers and/or a condition. |
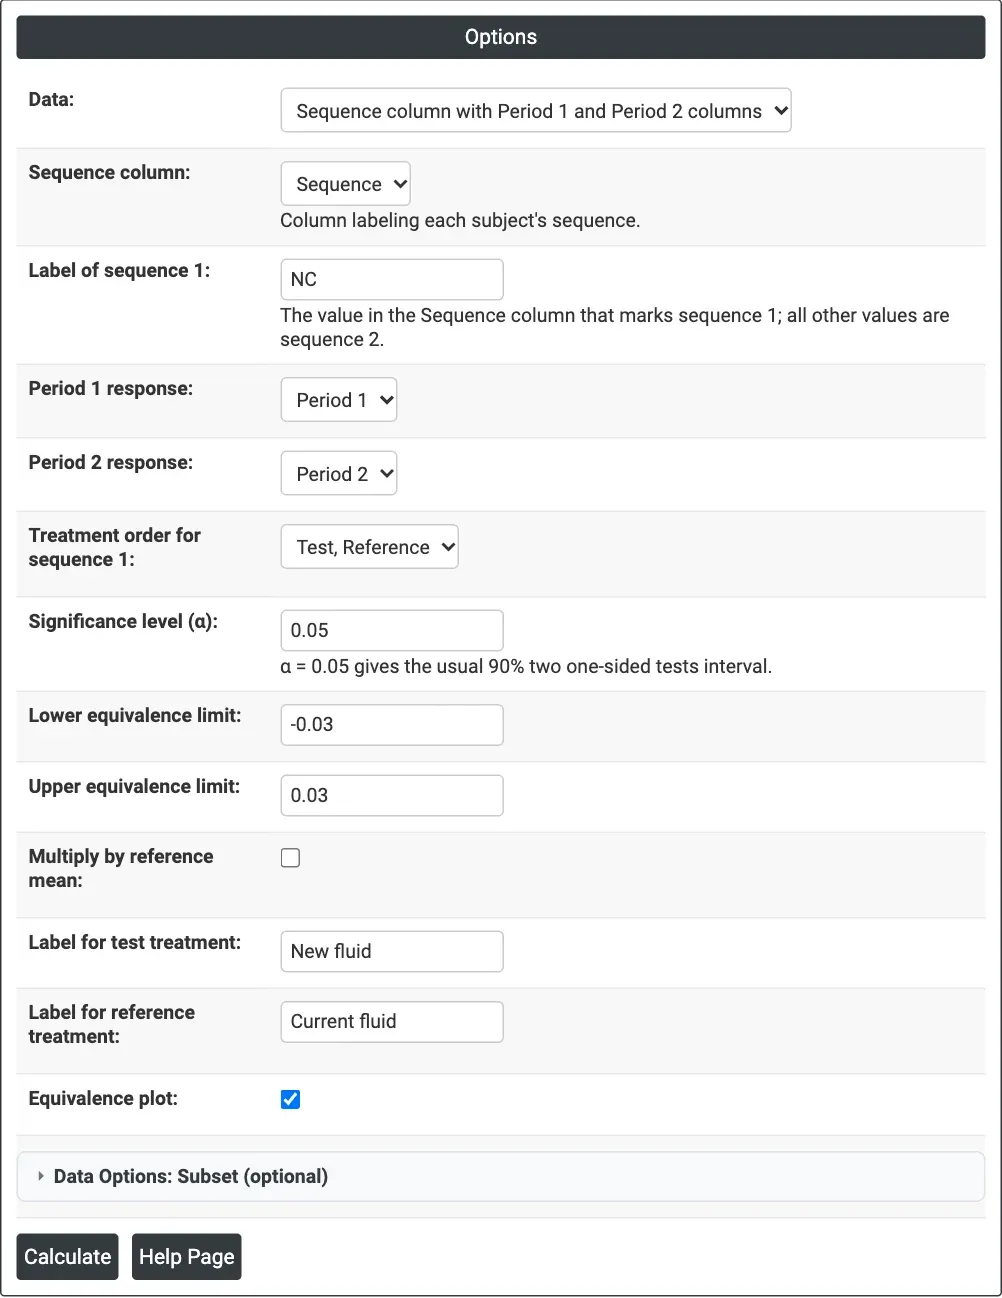
Figure 1 — Options for the cutting fluid example: Sequence column with label NC for sequence 1 (new fluid first), equivalence limits −0.03 and 0.03 µm.
Output Descriptions
- Method — the treatment order in each sequence (and the limits after multiplying by the reference mean).
- Descriptive Statistics — N, mean and standard deviation by sequence and period, and the within-subject standard deviation.
- Effects — Carryover, Treatment and Period effects with SE, DF, T-Value, P-Value and confidence interval.
- Difference: Mean(test) − Mean(reference) — the difference, SE, CI for equivalence and the equivalence interval, with the conclusion.
- Test — the hypotheses and the two one-sided t-tests, with the conclusion.
- Equivalence plot — the CI for equivalence against the lower (LEL) and upper (UEL) limits.
- PDF export via Download.
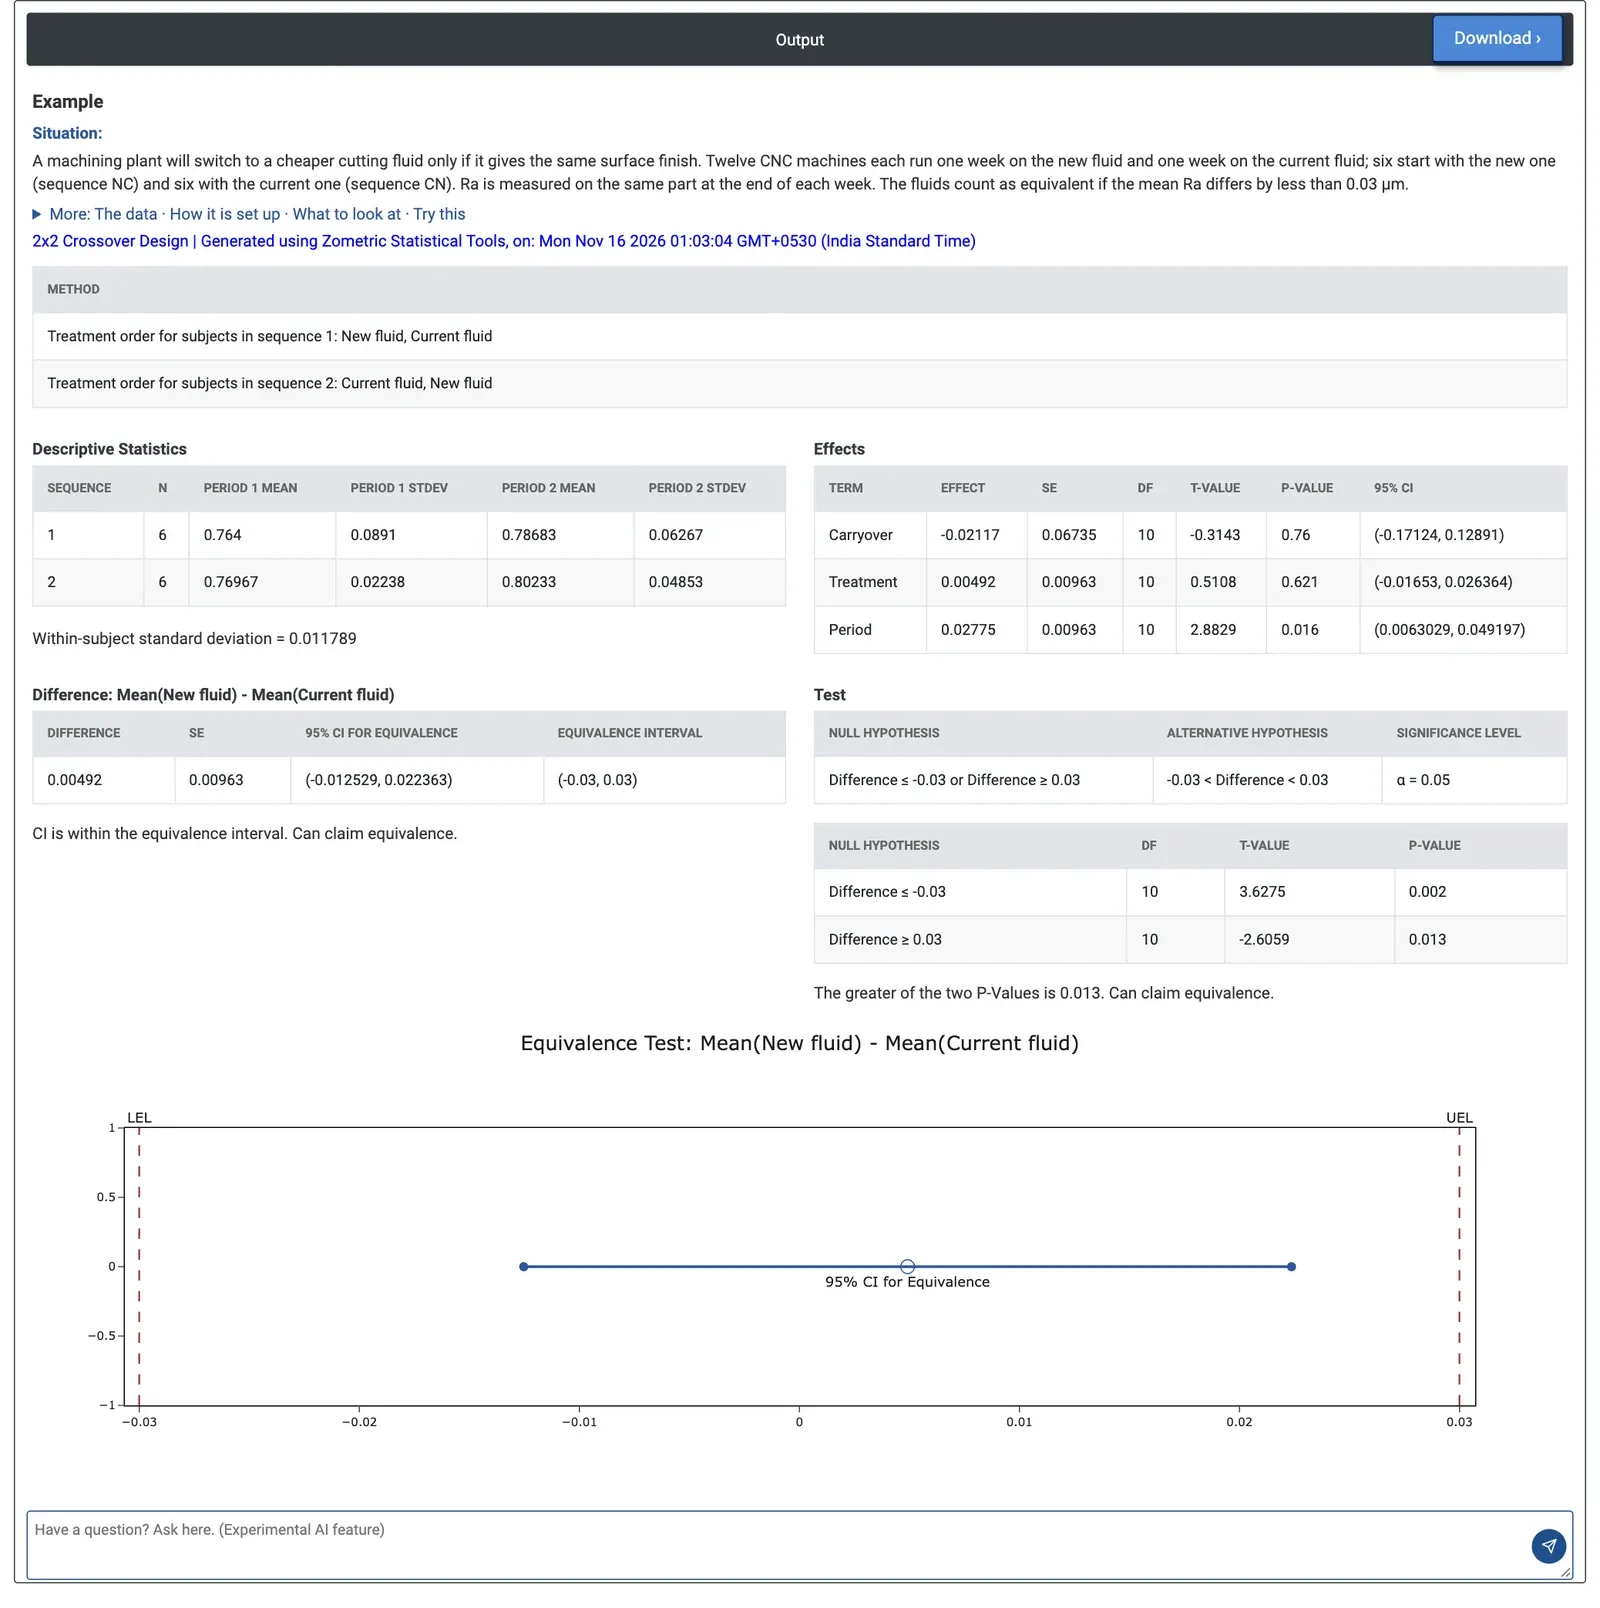
Figure 2 — Cutting fluid crossover: difference +0.00492 µm, CI for equivalence −0.0125 to 0.0224 µm, inside ±0.03 µm; the fluids are equivalent.
Worked Example
A machining plant will switch to a cheaper cutting fluid only if it gives the same surface finish. Twelve CNC machines each run one week on the new fluid and one week on the current fluid: six start with the new one (sequence NC) and six with the current one (CN). Ra (µm) is measured on the same part at the end of each week. The fluids count as equivalent if the mean Ra differs by less than 0.03 µm. The engineer enters NC as the label of sequence 1 with order Test, Reference, limits −0.03 and 0.03, and labels New fluid and Current fluid.
The new fluid gives Ra 0.00492 µm higher than the current one (SE 0.00963). The CI for equivalence, −0.012529 to 0.022363 µm, lies inside ±0.03, and both one-sided tests are significant (p = 0.002 and 0.013), so the fluids are equivalent for surface finish. Carryover is not significant (p = 0.76). The period effect is +0.02775 µm (p = 0.016): Ra was higher in the second week whatever the fluid, perhaps from tool wear, and the crossover design keeps this out of the fluid comparison.
With tighter limits of ±0.02 µm the upper end of the interval (0.022363) falls outside, the second test gives p = 0.074, and equivalence can no longer be claimed. The plant can switch fluids if a 0.03 µm difference is acceptable for its drawings.