
Area Graph
On this page
Purpose
An Area Graph shows how one or more quantities change over time, as shaded areas under their lines. With several columns stacked, the top edge is the total and each band is one part of it, so one graph answers two questions: is the total changing, and is the mix changing? Use it, for example, for weekly defect counts by type, downtime by cause, energy use by area or output by product line.
Key Capabilities
- One Y column, or several columns shown together, one colour band per column.
- Stack areas: each band sits on top of the ones below, so the top edge is the total.
- X axis from a column (week, date, batch) or from the row order.
- Data Options to exclude rows, or keep only rows, by row number or by a condition.
- Interactive graph: hover for values, click a legend entry to hide or show a series, zoom and download as an image.
Statistical Methods
No statistics are calculated: the graph plots the values as they are. Each selected Y column is converted to numbers, and rows with a missing or non-numeric value are left out for that column. When several Y columns are chosen, the tool lays them out as one series per column. The X axis is the chosen X-axis column; if none is chosen, the rows are numbered 1, 2, 3 … in their worksheet order, after any rows removed by Data Options.
With Stack areas ticked, the value of each series is added to the series below it, so the height of a band is that series' value and the upper edge of the top band is the sum of all series in that row. With Stack areas unticked (Simple), each series is drawn from zero on its own, so its own trend is easier to read but the total is not shown. A stacked graph reads best when the series are parts of one total measured in the same unit; put the most important or most stable series at the bottom, because the bands above it follow its ups and downs.
Input Fields & Options
Field | Description |
Y variable(s) | Required. One or more numeric columns. Hold Ctrl or Command to select several. |
X-axis column | Optional. The column for the horizontal axis; row order is used if left blank. |
Stack areas | Unticked by default (Simple, overlaid); ticked = Stack. |
Title | Title shown on the graph. Default Area Graph. |
Discrete color sequence | Palette for the series, default D3. |
Data Options: Subset (optional) | Exclude matching rows (default) or Include only matching rows, matched by Row numbers (e.g. 3,7,12-15, using the original grid row numbers) and/or a Condition (e.g. Week > 4). Has no effect unless Row numbers or Condition is filled in. |
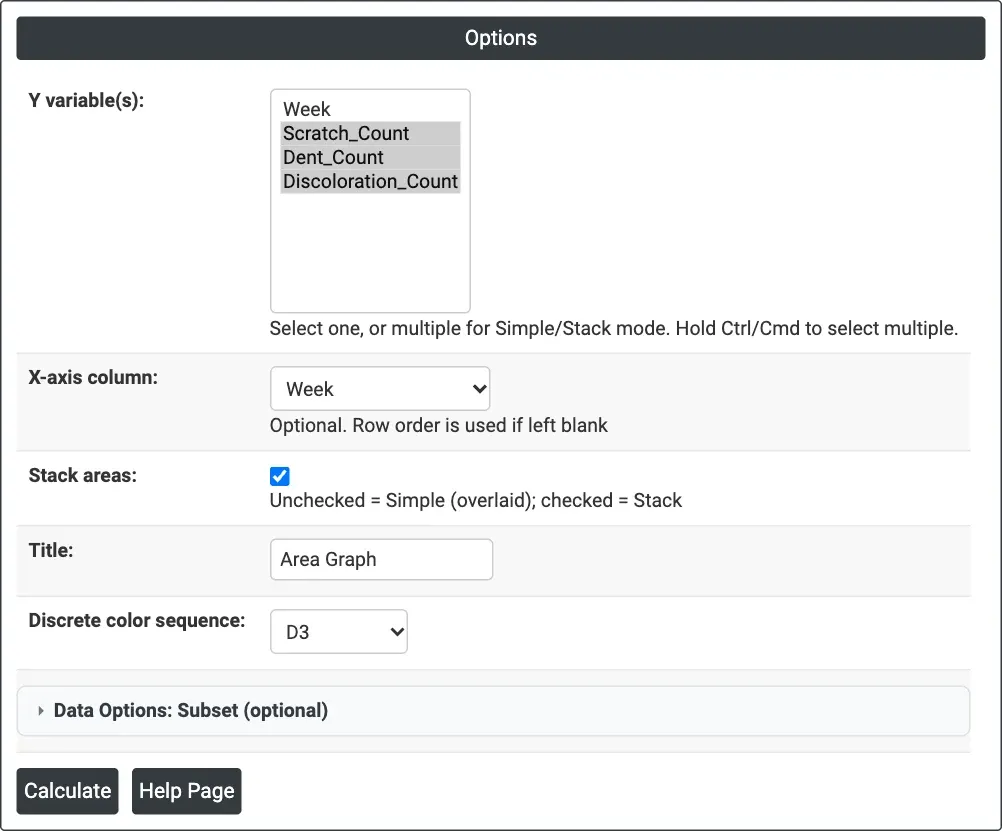
Figure 1 — Three defect-count columns stacked by Week.
Output Descriptions
- Area Graph — one shaded band per Y column against the X axis, with a legend listing the columns.
- PDF export via Download.
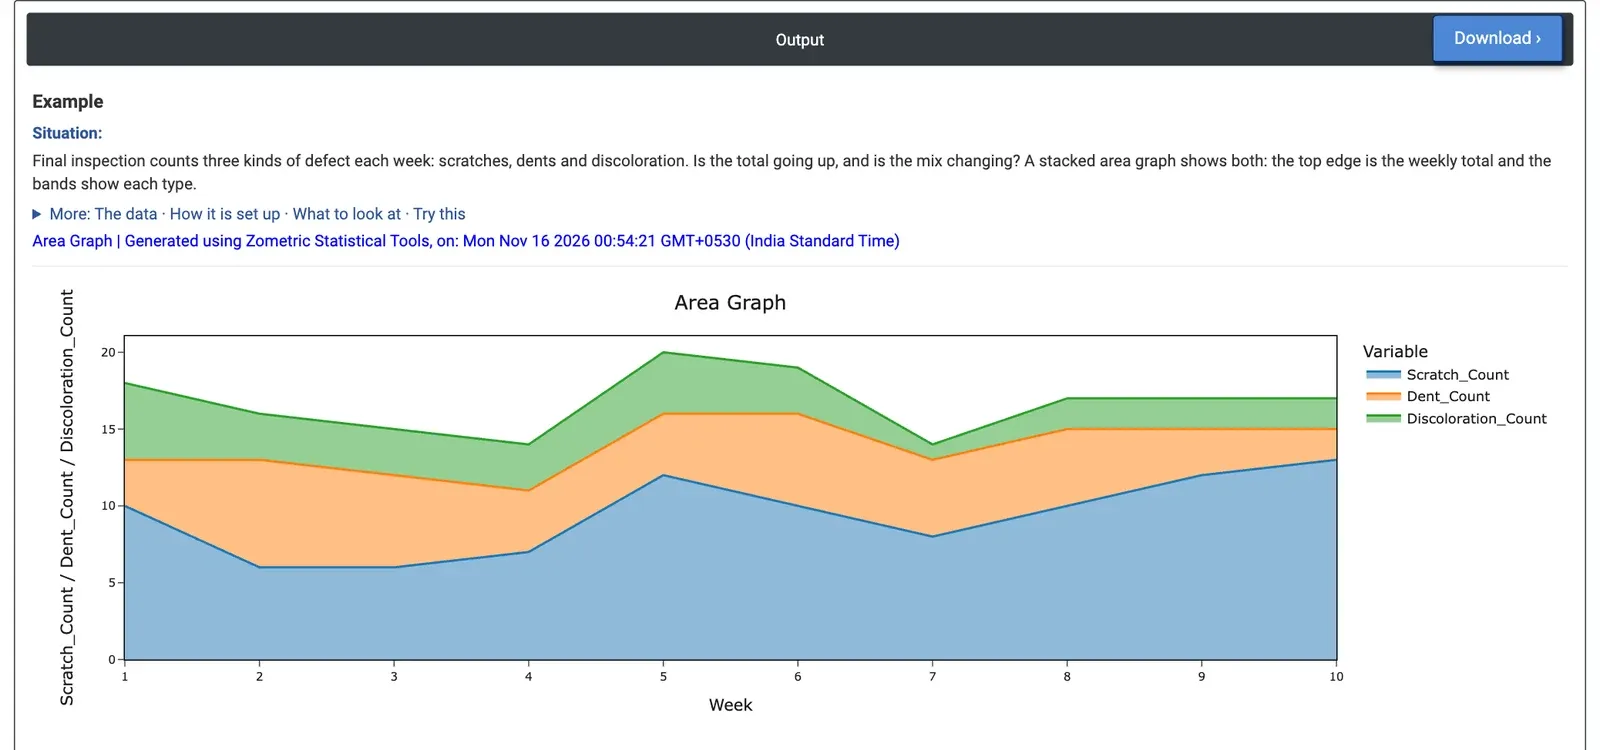
Figure 2 — Weekly defects by type: the total stays between 14 and 20, while the scratch band grows.
Worked Example
Final inspection counts three kinds of defect each week: scratches, dents and discoloration. After ten weeks the quality engineer wants to know whether the total is going up and whether the mix is changing. The engineer selects Scratch_Count, Dent_Count and Discoloration_Count as Y variable(s), Week as X-axis column, and ticks Stack areas.
The top edge of the graph, the weekly total, stays between 14 and 20 defects with no clear trend: 83 defects in weeks 1 to 5 and 84 in weeks 6 to 10. The bands tell a different story. Scratches rise from 41 in the first five weeks to 53 in the last five, and make up 13 of the 17 defects in week 10. Discoloration falls from 18 to 10 over the same halves, and dents change little (24 to 21).
For the decision this means the flat total hides a growing problem: scratches are now the defect to work on, for example by checking handling and packing since week 5. With Stack areas unticked, each defect type is drawn from zero on its own, which makes each trend easier to compare but no longer shows the total.