
Best Subsets Regression
On this page
Purpose
Best Subsets Regression fits a linear regression for every combination of the candidate predictors and lists the best models of each size side by side. Use it early in a study, when you have several possible process settings and want the smallest set that explains most of the variation in the response, before you fit the chosen model in detail with Fit Regression Model.
Key Capabilities
- Fits every subset of the free predictors, from the minimum to the maximum number you set.
- Shows the best one to five models of each size, ranked by R-Sq.
- Reports R-Sq, R-Sq(adj), R-Sq(pred), Mallows' Cp and S for every model, with PRESS, AICc and BIC on request.
- Predictors in all models: force variables you know matter into every subset.
- Enhanced tables add the variance inflation factor (VIF) of each predictor in each model, to spot correlated predictors.
- Model with or without an intercept.
Statistical Methods
Rows with a missing or non-numeric value in the response or any selected predictor are dropped. For each subset size from the minimum to the maximum, the tool fits an ordinary least squares model for every combination of that many free predictors (plus any forced predictors), sorts them by R-Sq and keeps the top models of each size. With p free predictors there are 2ᵖ − 1 subsets, so each added candidate doubles the number of fits.
For a model with k coefficients (including the constant) fitted to n rows: S = √MSE; R-Sq(adj) corrects R-Sq for the number of terms; PRESS = Σ (eᵢ / (1 − hᵢ))², the sum of squared leave-one-out prediction errors using the leverages hᵢ; R-Sq(pred) = 1 − PRESS / SS Total. Mallows' Cp = SSE / MSE(full) − (n − 2k), where MSE(full) is the error mean square of the model with all predictors; a model with little bias has Cp close to k, and the full model always has Cp = k. AICc = −2 log L + 2(k+1) + 2(k+1)(k+2)/(n − k − 2) and BIC = −2 log L + (k+1) ln n, counting σ as a parameter; smaller is better for PRESS, AICc and BIC.
Look for the model where R-Sq(adj) and R-Sq(pred) stop rising, Cp is close to the number of coefficients and S is small. A large gap between R-Sq and R-Sq(pred) warns of overfitting. Best subsets only compares fits: check the chosen model's residuals and coefficients in Fit Regression Model.
Input Fields & Options
Field | Description |
Response (Y) | Numeric column to be explained. Required. |
Free predictors | Numeric candidate predictors; every combination is tried. Required. Ctrl or Command + click to select several. |
Predictors in all models (optional) | Numeric predictors included in every model. They must not also be free predictors. |
Models of each size to display | How many of the best models of each size are listed, 1 to 5. Default 2. |
Display PRESS / Display AICc / Display BIC | Add these columns to the table. Off by default. |
Free Predictors: Minimum / Maximum | Smallest and largest number of free predictors in a model. Default 1 to all of them. |
Fit intercept | Ticked by default. Untick to fit models through the origin (R-Sq is then uncentred). |
Display of results | Simple tables (default) or Enhanced tables, which add a VIF column for each predictor. |
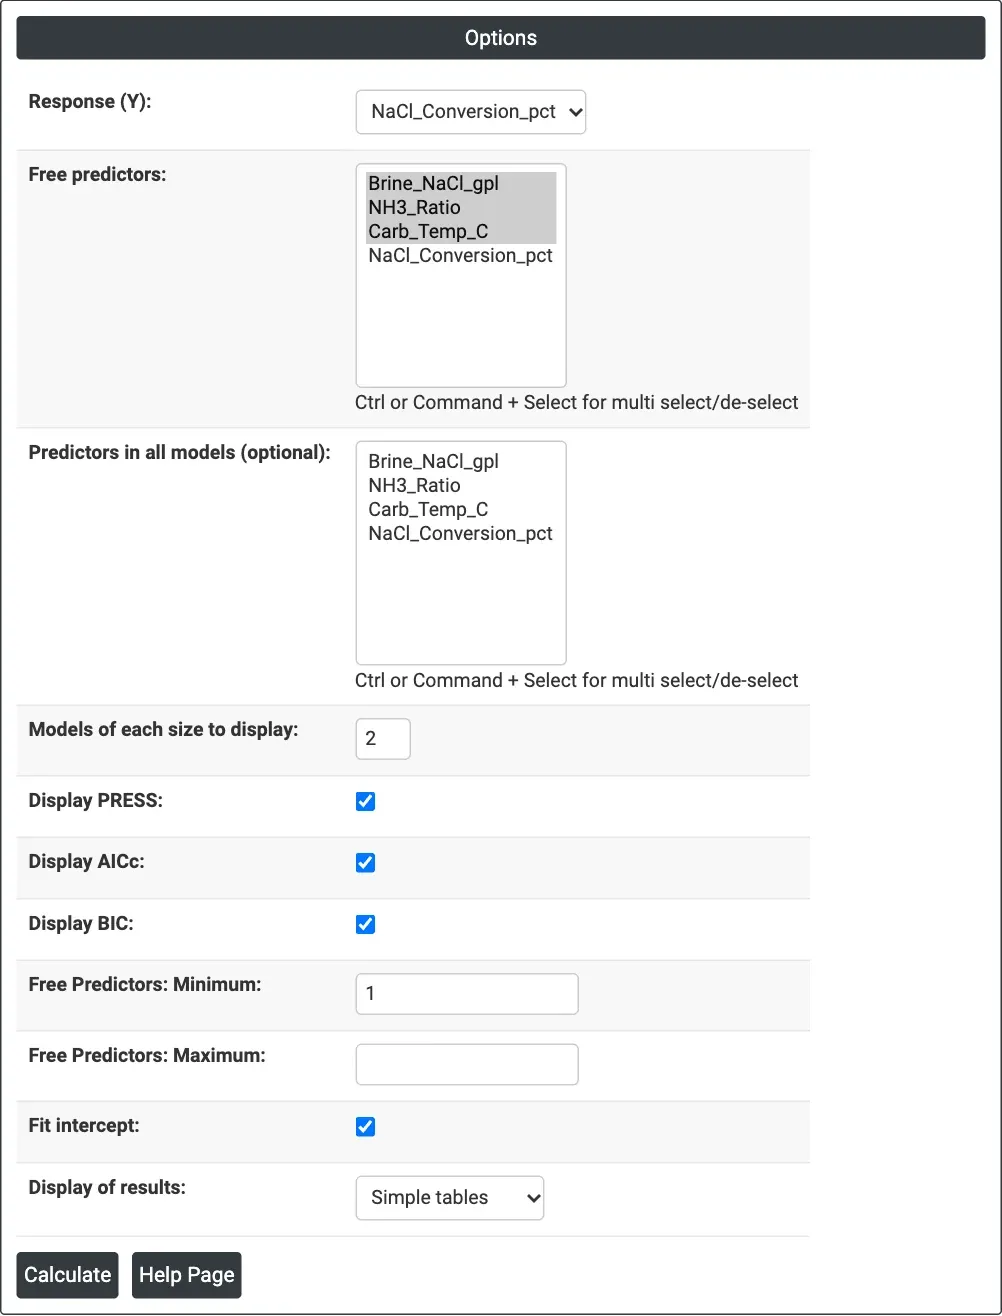
Figure 1 — Options for the soda ash example: NaCl_Conversion_pct as the response, the three process settings as free predictors, with PRESS, AICc and BIC displayed.
Output Descriptions
- Response line — names the response and any predictors forced into all models.
- Best Subsets Results table — one row per model: Vars (number of free predictors), R-Sq, R-Sq(adj), R-Sq(pred), Mallows' Cp, S, optional PRESS, AICc and BIC, and an X under each predictor in the model; with Enhanced tables, VIF for each predictor in the model.
- PDF export via Download.
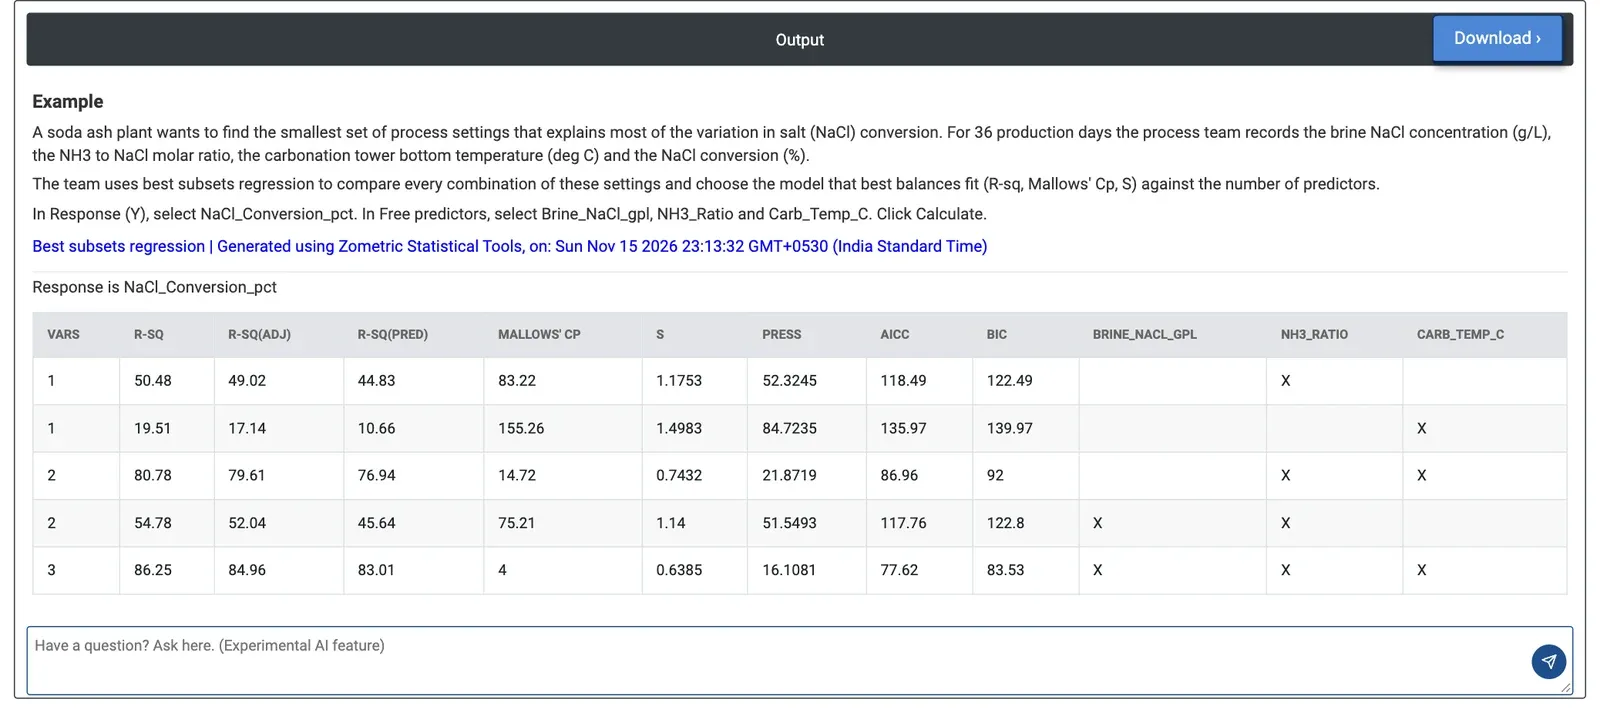
Figure 2 — Best subsets results for NaCl conversion: the three-predictor model has R-Sq 86.25%, R-Sq(pred) 83.01%, Cp 4 and S 0.6385.
Worked Example
A soda ash plant wants to know which process settings explain the daily NaCl conversion (%). Over 36 production days the team records the brine NaCl concentration (Brine_NaCl_gpl), the NH3 to NaCl molar ratio (NH3_Ratio) and the carbonation tower bottom temperature (Carb_Temp_C). They select NaCl_Conversion_pct as the response, the three settings as free predictors, keep two models of each size and tick Display PRESS, AICc and BIC.
On its own the NH3 ratio is the best single predictor, but it explains only 50.48% of the variation (Cp 83.22). Adding the carbonation temperature lifts R-Sq to 80.78% and cuts S from 1.1753 to 0.7432 percentage points, yet Cp is still 14.72, well above the 3 coefficients of that model, so something is missing. With all three settings R-Sq is 86.25%, R-Sq(pred) 83.01%, S 0.6385 and PRESS, AICc and BIC are the lowest in the table (16.1081, 77.62 and 83.53). The small gap between R-Sq and R-Sq(pred) shows the model is not overfitted.
The team keeps all three settings and fits them with Fit Regression Model. Ticking Enhanced tables shows VIFs of 1.01 to 1.03, so the three settings were not changed together and each effect can be read on its own.