
Cause-and-Effect (Fishbone) Diagram
On this page
Purpose
The Cause-and-Effect (Fishbone or Ishikawa) Diagram sorts the possible causes of a problem into groups, so a team can see the whole list of suspects in one picture before deciding which ones to check with data. The effect (the problem) sits at the head of the fish; the causes hang off up to six branches, by default the 6M headings Personnel, Machines, Materials, Methods, Measurements and Environment. Use it in the Analyse phase of a project, after a brainstorming session, or to record what a team already suspects about a defect.
Key Capabilities
- Up to six branches, each with its causes read from a worksheet column or typed in as constants.
- Branch labels you can rename (for example Man, Machine, Method for a 4M diagram, or service headings such as Policies and Systems).
- Sub-branches: any cause can get its own sub-causes, from a column or typed in, to show a deeper level of why.
- The effect is written at the head of the fish, and the diagram can carry its own title.
- Options to leave the branches unlabelled or to hide branches that have no causes.
- No data needed for a blank diagram to fill in at a meeting.
- PDF export via Download.
Statistical Methods
The tool does no calculation: it draws the causes you give it. It follows the usual practice for an Ishikawa diagram: the problem is stated as an effect, causes are grouped under main categories (the 6M headings are the default), and each cause can be broken down further with sub-causes, as in a 5-Whys analysis. Branches 1, 3 and 5 are drawn above the spine and branches 2, 4 and 6 below it, with branch 1 nearest the effect.
With In column, every non-blank cell of the chosen column becomes one cause, in worksheet order; numbers are shown without trailing decimals. With Constants, causes are separated by spaces and a cause of several words is enclosed in double quotes, for example "Operator training" Fatigue. Causes, labels and the effect can be up to 72 characters; a longer cause stops the diagram with a message naming it.
A fishbone diagram is a list of possible causes, not proof. The usual next step is to pick the most likely causes (by team vote, a C&E Matrix or process knowledge) and test them with data, for example with a hypothesis test, a regression or a designed experiment.
Input Fields & Options
Field | Description |
Branch 1–6 causes | Where the causes of each branch come from: In column (default) or Constants. |
Column | The worksheet column holding the causes of the branch, one per cell (In column). |
Constants | Causes typed in, separated by spaces; enclose a cause of several words in double quotes (Constants). |
Label | The name shown at the end of the branch. Defaults: Personnel, Machines, Materials, Methods, Measurements, Environment. |
Sub-branches (n) | Opens a table of the branch's causes; for any cause choose a column or type constants to give it sub-causes. The number shows how many causes have sub-branches. |
Effect | Optional. The problem, shown at the head of the fish (up to 72 characters). |
Title | Title above the diagram. Default Cause-and-Effect Diagram. |
Do not label the branches | Unticked by default. Ticked: branch labels are left off. |
Do not display empty branches | Unticked by default. Ticked: branches with no causes are not drawn. |
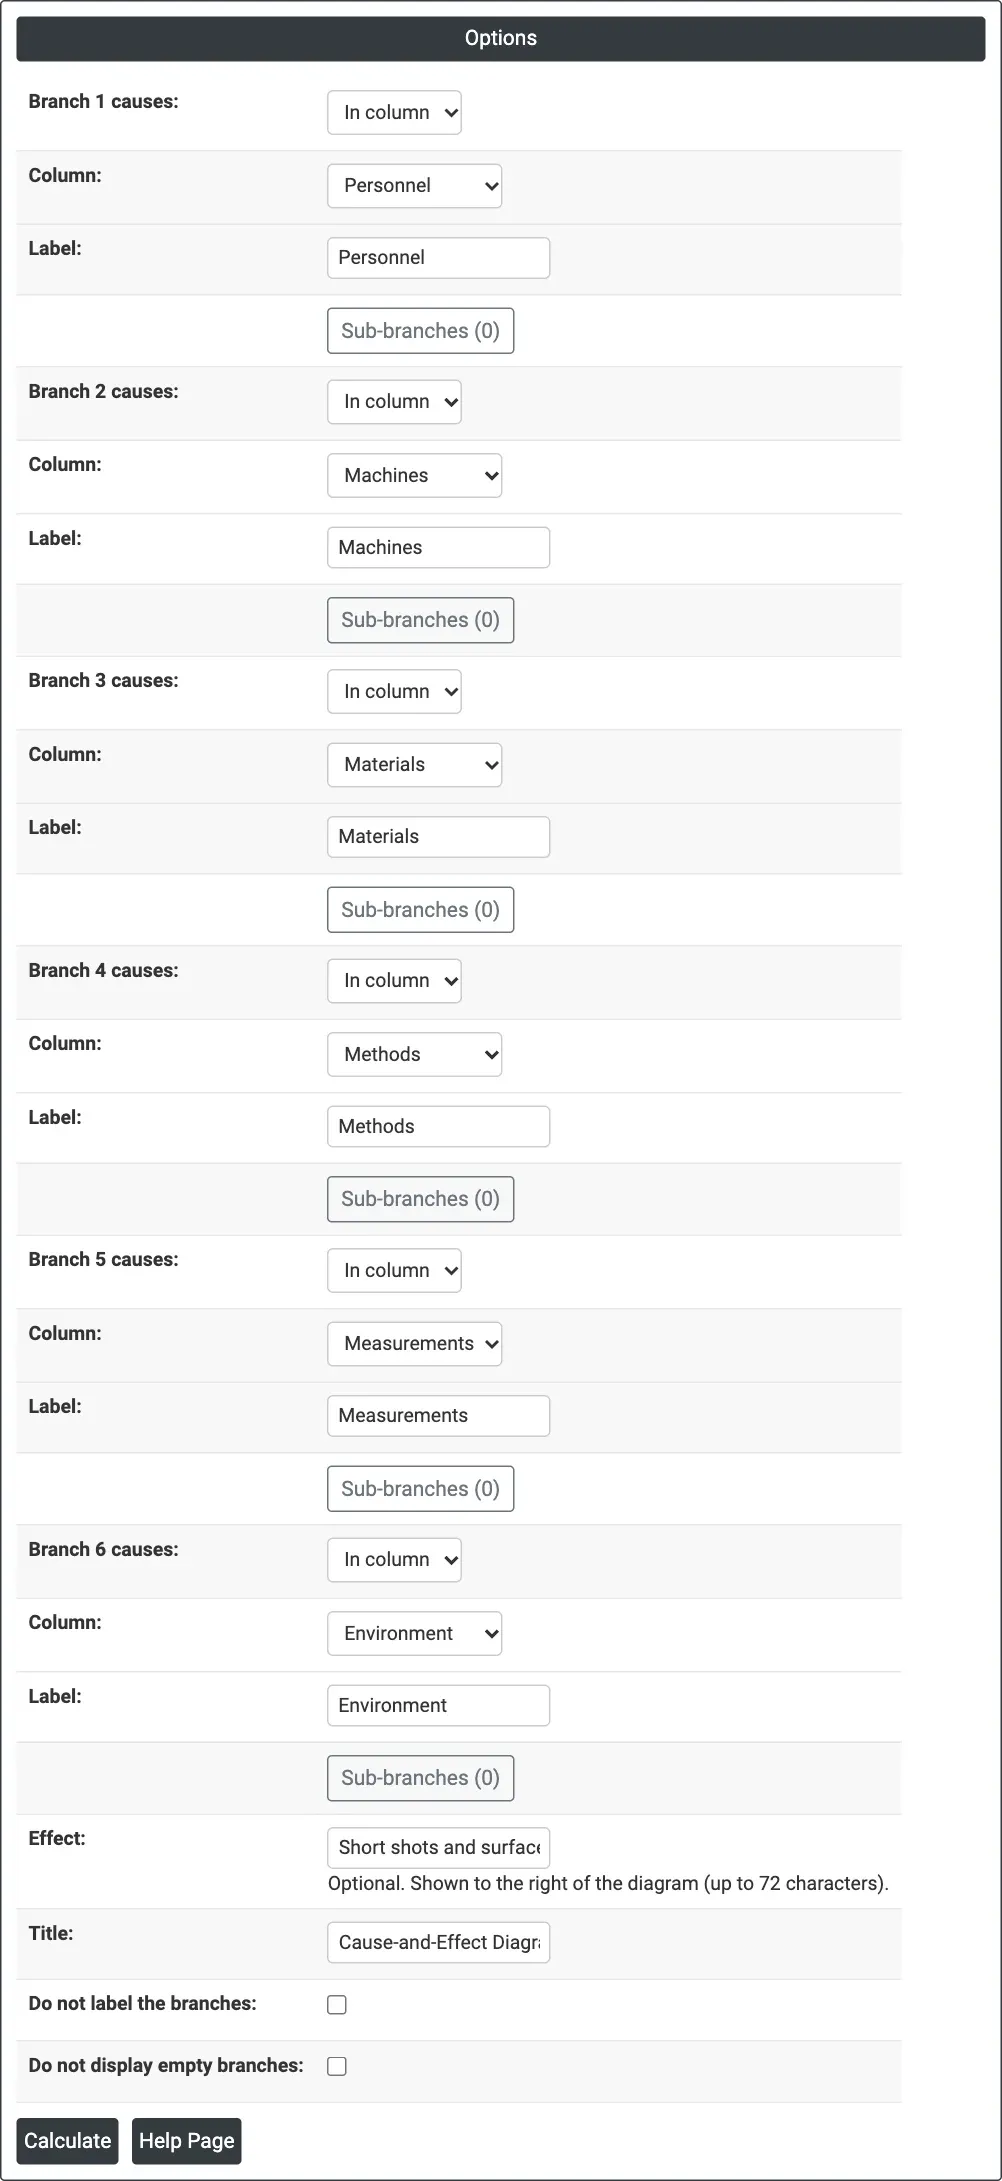
Figure 1 — Options for the example: the six branches read their causes from the worksheet columns Personnel to Environment, with the effect “Short shots and surface defects”.
Output Descriptions
- Cause-and-Effect Diagram — the fishbone: the effect at the head, one diagonal branch per category with its label, and each cause (and sub-cause) written along its branch.
- PDF export via Download.
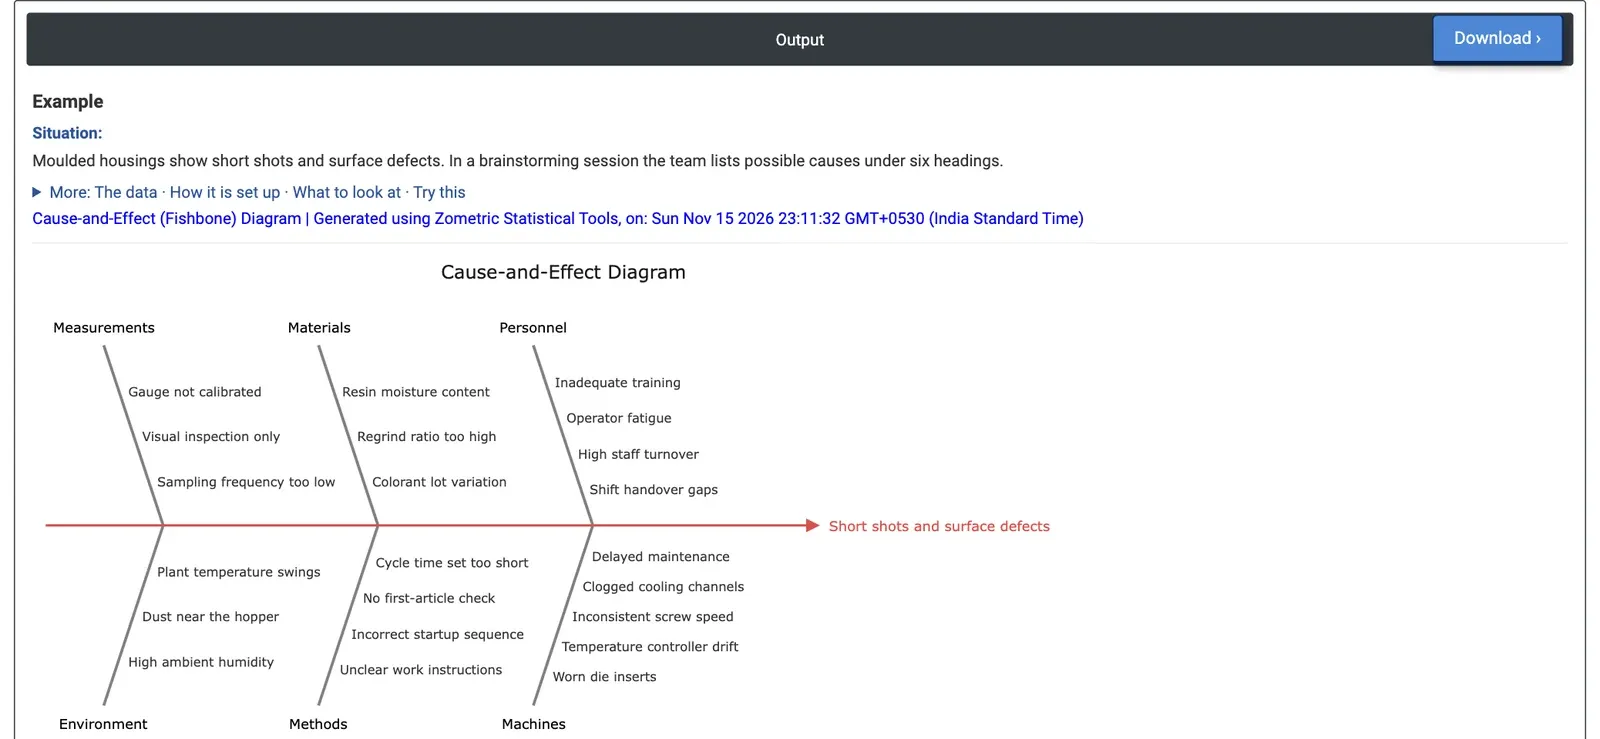
Figure 2 — Fishbone diagram for short shots and surface defects on moulded housings: 22 possible causes under six headings.
Worked Example
Moulded housings from an injection moulding cell show short shots and surface defects. In a brainstorming session the team lists the possible causes under six headings and enters them in the worksheet, one column per heading: Personnel (for example inadequate training, operator fatigue), Machines (worn die inserts, temperature controller drift, clogged cooling channels), Materials (resin moisture content, regrind ratio too high, colorant lot variation), Methods (unclear work instructions, cycle time set too short), Measurements (gauge not calibrated, visual inspection only) and Environment (high ambient humidity, dust near the hopper).
Branch 1 to Branch 6 read the six columns in the same order and the Effect is “Short shots and surface defects”. The diagram shows 22 causes: 4 under Personnel, 5 under Machines, 3 under Materials, 4 under Methods, 3 under Measurements and 3 under Environment. The team now has one picture of every suspect. Several causes can be checked quickly with data the cell already has, such as resin moisture by lot and the cooling channel maintenance records; these go into the data collection plan first. To dig into a cause, open Sub-branches on its branch and add sub-causes, for example why the die inserts wear early.