
C&E Matrix (X-Y Matrix)
On this page
Purpose
The C&E Matrix (cause-and-effect or X-Y matrix) ranks the process inputs (Xs) by how strongly they affect the outputs (Ys) the customer cares about. The team rates each input against each output, the ratings are weighted by the importance of each output, and the inputs with the highest weighted values are the ones to study first, for example in an FMEA, a capability study or a designed experiment. It usually follows a process map or a fishbone diagram, when there are more suspects than the team can check.
Key Capabilities
- Any number of inputs (rows) and outputs (columns), entered in the worksheet.
- Weighted Value by Input and % of Net Effect by Input for each input, and the Weighted effect on each output.
- Optional Process Map - Activity column to show where each input sits in the process, and a Status column for the team's decision (Critical, Potential, Eliminated).
- Pareto chart of the inputs, largest weighted value first, with the cumulative percent.
- Check the Ratings: flags ratings that are not 0, 1, 3 or 9 and importance values outside 1 to 9.
- Objective and Conclusion recorded with the matrix, and PDF export via Download.
Statistical Methods
Each output j has an importance wⱼ to the customer (1 to 9), and each input i a rating rᵢⱼ of its effect on that output on the 0, 1, 3, 9 scale (none, little, moderate, strong). The tool computes Weighted Value by Input = Σⱼ wⱼ·rᵢⱼ, % of Net Effect by Input = weighted value / sum of all weighted values × 100, and Weighted effect on each output = wⱼ × Σᵢ rᵢⱼ. A blank rating counts as 0. The spread-out 0, 1, 3, 9 scale is standard practice: it separates the strong effects from the rest instead of letting many middling scores add up.
The worksheet needs a column named Inputs (also Input, X, X Variables or Inputs (X Variables)), one input per row, and one numeric column per output, named after the output. A row whose Inputs cell starts with Importance holds the importance of each output. Optional columns Process Map - Activity (also Activity, Process Step or Step) and Status are carried into the table; every other column with numbers is treated as an output. The ratings are a team judgement, so the ranking is only as good as the knowledge in the room: confirm the top inputs with data before acting on them.
Input Fields & Options
Field | Description |
Project Name / Prepared By / Prepared Date | Header of the report. |
Objective | Free text: what the matrix is for. Its help text describes the worksheet layout. |
Conclusion | Free text: the decision the team took from the matrix. |
Worksheet | Columns Inputs, one column per output with ratings 0, 1, 3 or 9, and an Importance row; optional Process Map - Activity and Status. Load Example fills in a complete matrix. |
Calculate | Computes the matrix and draws the Pareto chart. |
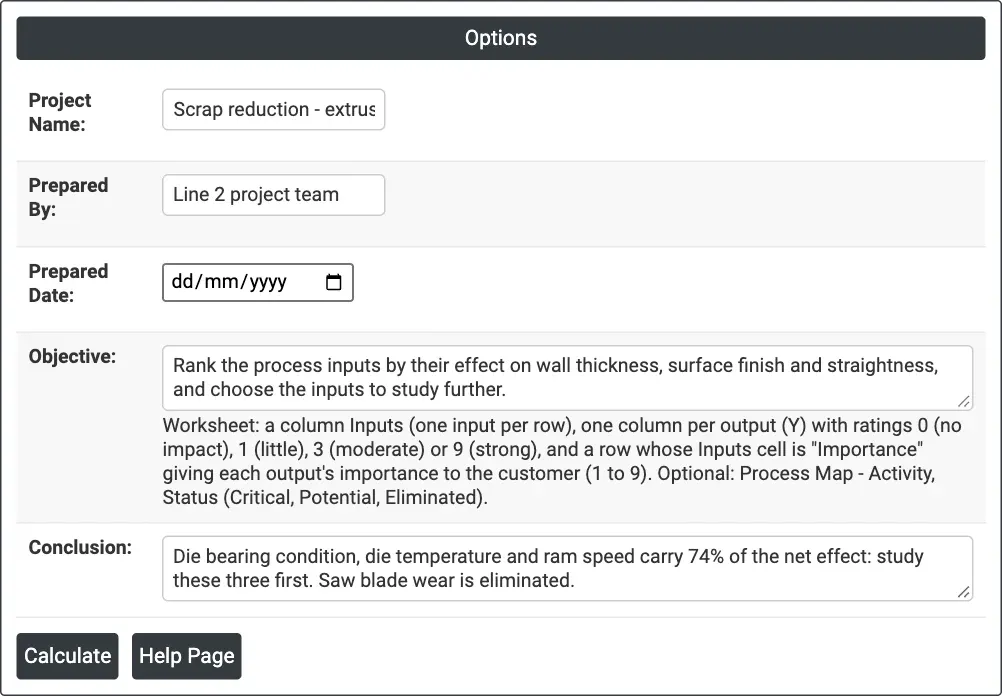
Figure 1 — Options for the example: project header, objective and the team's conclusion for the C&E matrix of extrusion line 2.
Output Descriptions
- C&E Matrix (X-Y Matrix) — Project Name, Prepared By and Prepared Date.
- C&E Matrix — the importance row, one row per input with its ratings, Weighted Value by Input, % of Net Effect by Input and Status, and the Weighted effect on each output row.
- Input Effect — Pareto chart of the weighted value of each input, largest first, with the cumulative percent on the right axis.
- Summary — the Objective and Conclusion.
- Check the Ratings — shown only when a rating or importance is off the scale.
- PDF export via Download.
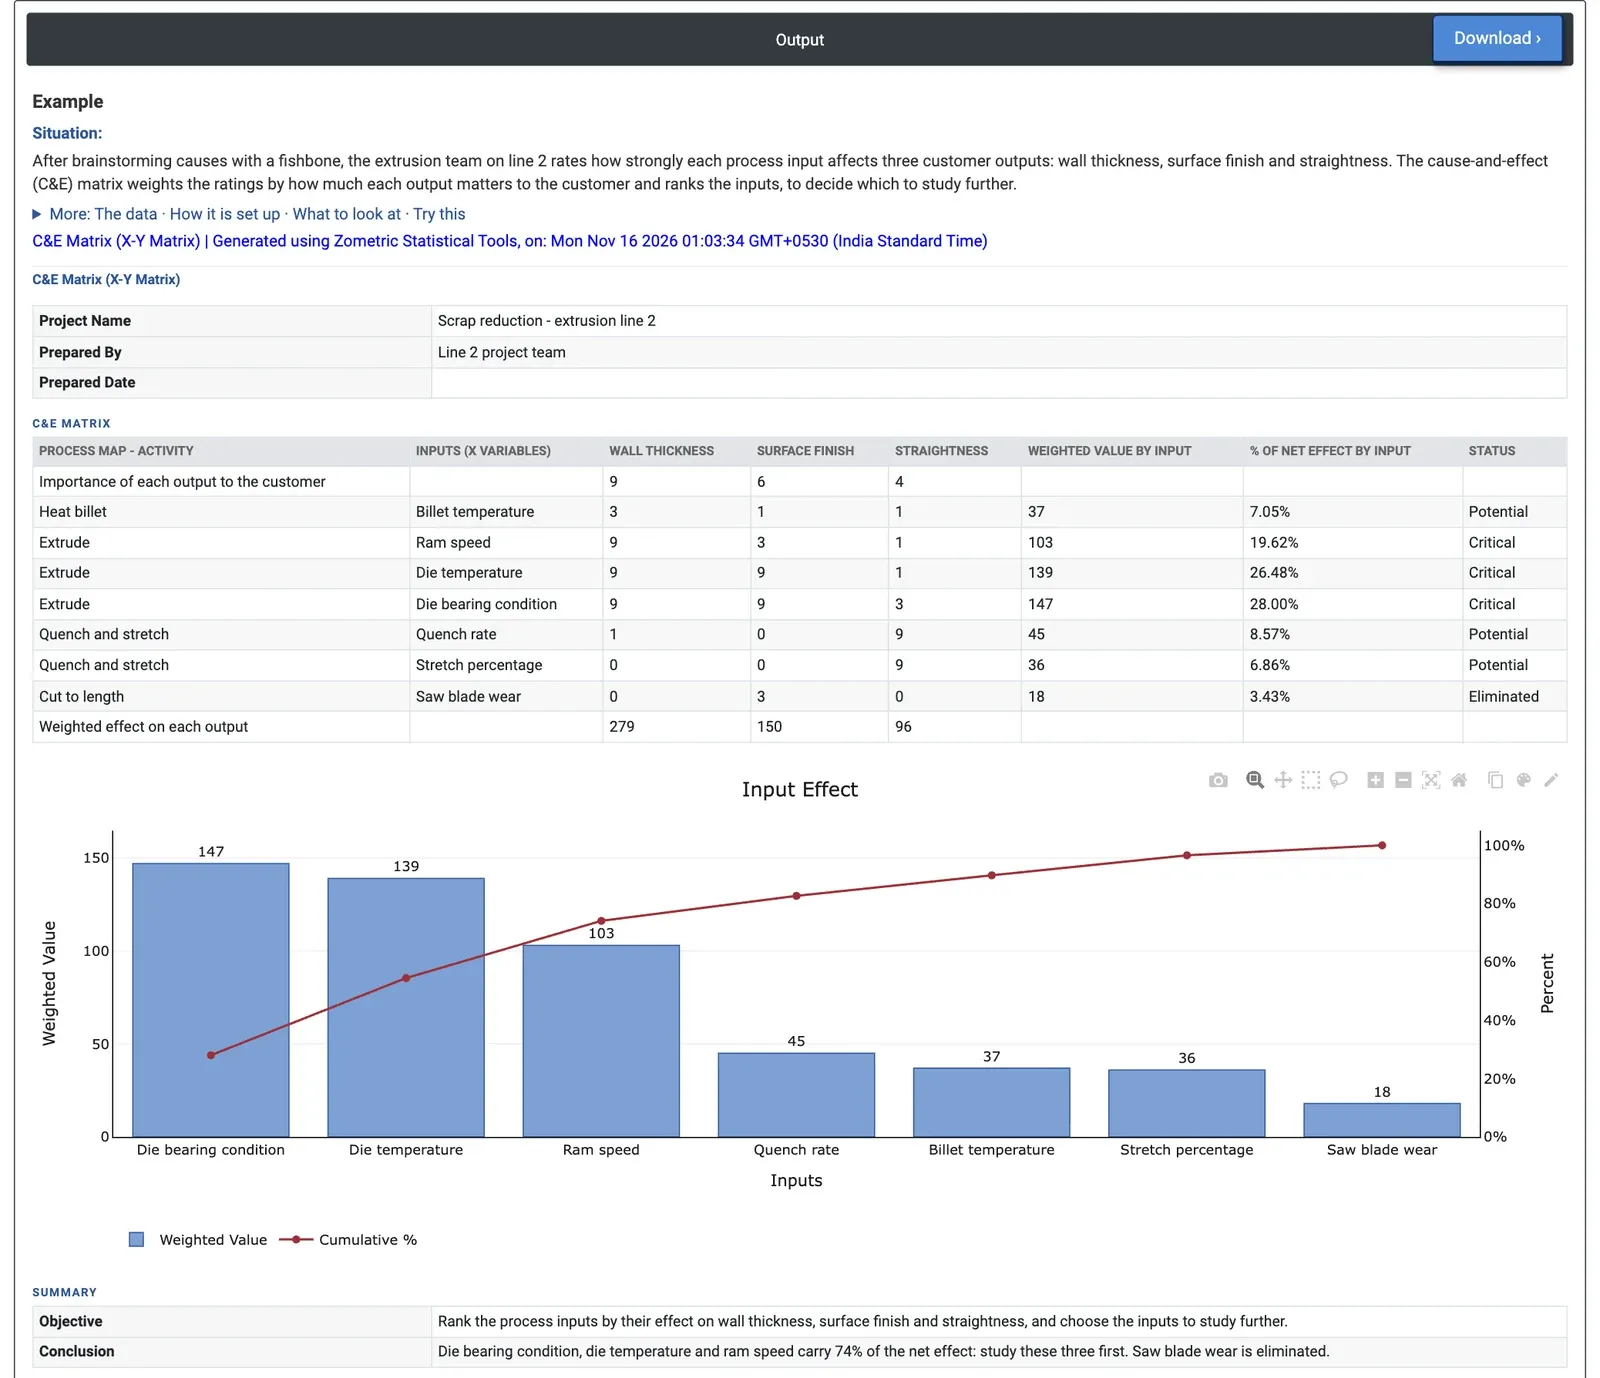
Figure 2 — C&E matrix for extrusion line 2: die bearing condition, die temperature and ram speed carry 74% of the net effect.
Worked Example
After a fishbone session on scrap at extrusion line 2, the team rates seven process inputs against three customer outputs: wall thickness (importance 9), surface finish (6) and straightness (4). Each rating is 0, 1, 3 or 9, and the inputs are grouped by process step: heat billet, extrude, quench and stretch, and cut to length.
Die bearing condition scores highest at 147 (9×9 + 6×9 + 4×3), 28.00% of the net effect of 525, followed by die temperature at 139 (26.48%) and ram speed at 103 (19.62%). Together the three carry 74% of the net effect, and the Pareto curve flattens after them: quench rate (45), billet temperature (37) and stretch percentage (36) follow, and saw blade wear scores only 18 (3.43%). Wall thickness carries the most weighted effect (279), then surface finish (150) and straightness (96). The team marks the top three inputs Critical and studies them first, keeps the middle three as Potential and eliminates saw blade wear. No rating is off the 0, 1, 3, 9 scale, so no Check the Ratings table appears.