
Cluster Variables
On this page
Purpose
Cluster Variables groups variables (columns) that carry similar information. Variables that rise and fall together across the observations are joined first, and the result is drawn as a dendrogram. Use it to cut down a long list of measurements or survey items: when several variables fall in the same cluster, you can track one of them, or a combined score, instead of all of them.
Key Capabilities
- Hierarchical clustering of three or more numeric variables.
- Distance based on correlation, absolute correlation or Euclidean distance.
- Seven linkage methods: Single, Complete, Average, Centroid, Median, McQuitty and Ward.
- Dendrogram showing the order and level at which variables join.
- Optional cluster assignment for each variable when you give a number of clusters.
Statistical Methods
Rows with a missing or non-numeric value in any selected variable are dropped; at least 3 variables and 3 complete rows are needed. Each variable is treated as a point whose coordinates are its values across the rows, and the distance between every pair of variables is computed with the chosen measure. Correlation distance is 1 − r, where r is the Pearson correlation between the two variables: 0 for a perfect positive correlation and 2 for a perfect negative one. Absolute Correlation distance is 1 − |r|, which treats a strong negative relationship as just as close as a strong positive one. Euclidean distance is √Σ(xᵢ − yᵢ)² on the raw values, so it depends on the units of each variable.
Clustering starts with each variable on its own and repeatedly merges the two closest clusters. The linkage method sets the distance between clusters: Single uses the closest pair, Complete the farthest pair, Average the mean of all pairwise distances, McQuitty a weighted average, Centroid and Median the distance between cluster centres, and Ward the smallest increase in within-cluster sum of squares. Ward, Centroid and Median need the Euclidean distance; the tool refuses other combinations.
With correlation distance, a join at height h means the variables in the two branches have an average correlation of about 1 − h. When Number of clusters is entered, the tree is cut to give that many clusters and each variable is labelled with its cluster.
Input Fields & Options
Field | Description |
Variables | Three or more numeric columns to group. Ctrl or Command + click to select several. |
Linkage method | How the distance between clusters is measured: Single, Complete, Average (default), Centroid, Median, McQuitty or Ward. |
Distance measure | Correlation (default), Absolute Correlation or Euclidean. |
Number of clusters | Optional, 2 or more. Cuts the tree into this many clusters and adds the Cluster Assignments table. Leave empty to only show the dendrogram. |
Title | Title shown on the dendrogram. Default Cluster Variables. |
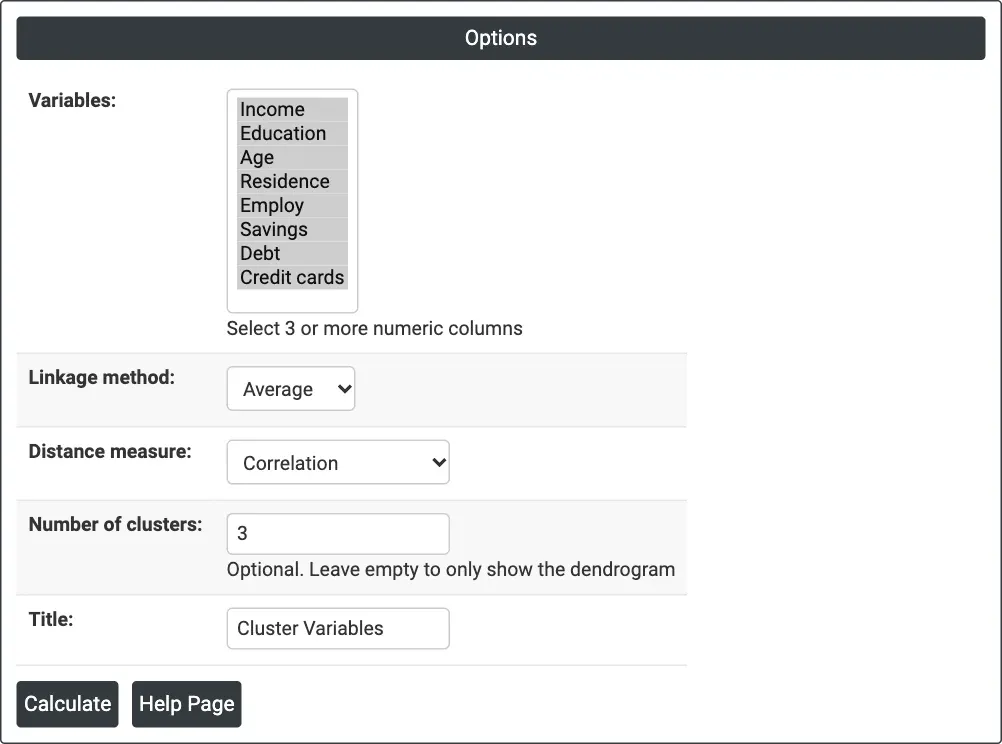
Figure 1 — Options for the example: eight loan-applicant variables, Average linkage, Correlation distance, 3 clusters.
Output Descriptions
- Dendrogram — the variables along the x-axis in tree order; the y-axis (Distance) shows the level at which branches join. The lower the join, the more alike the variables.
- Cluster Assignments — shown when Number of clusters is entered: each variable and its cluster number.
- PDF export via Download.
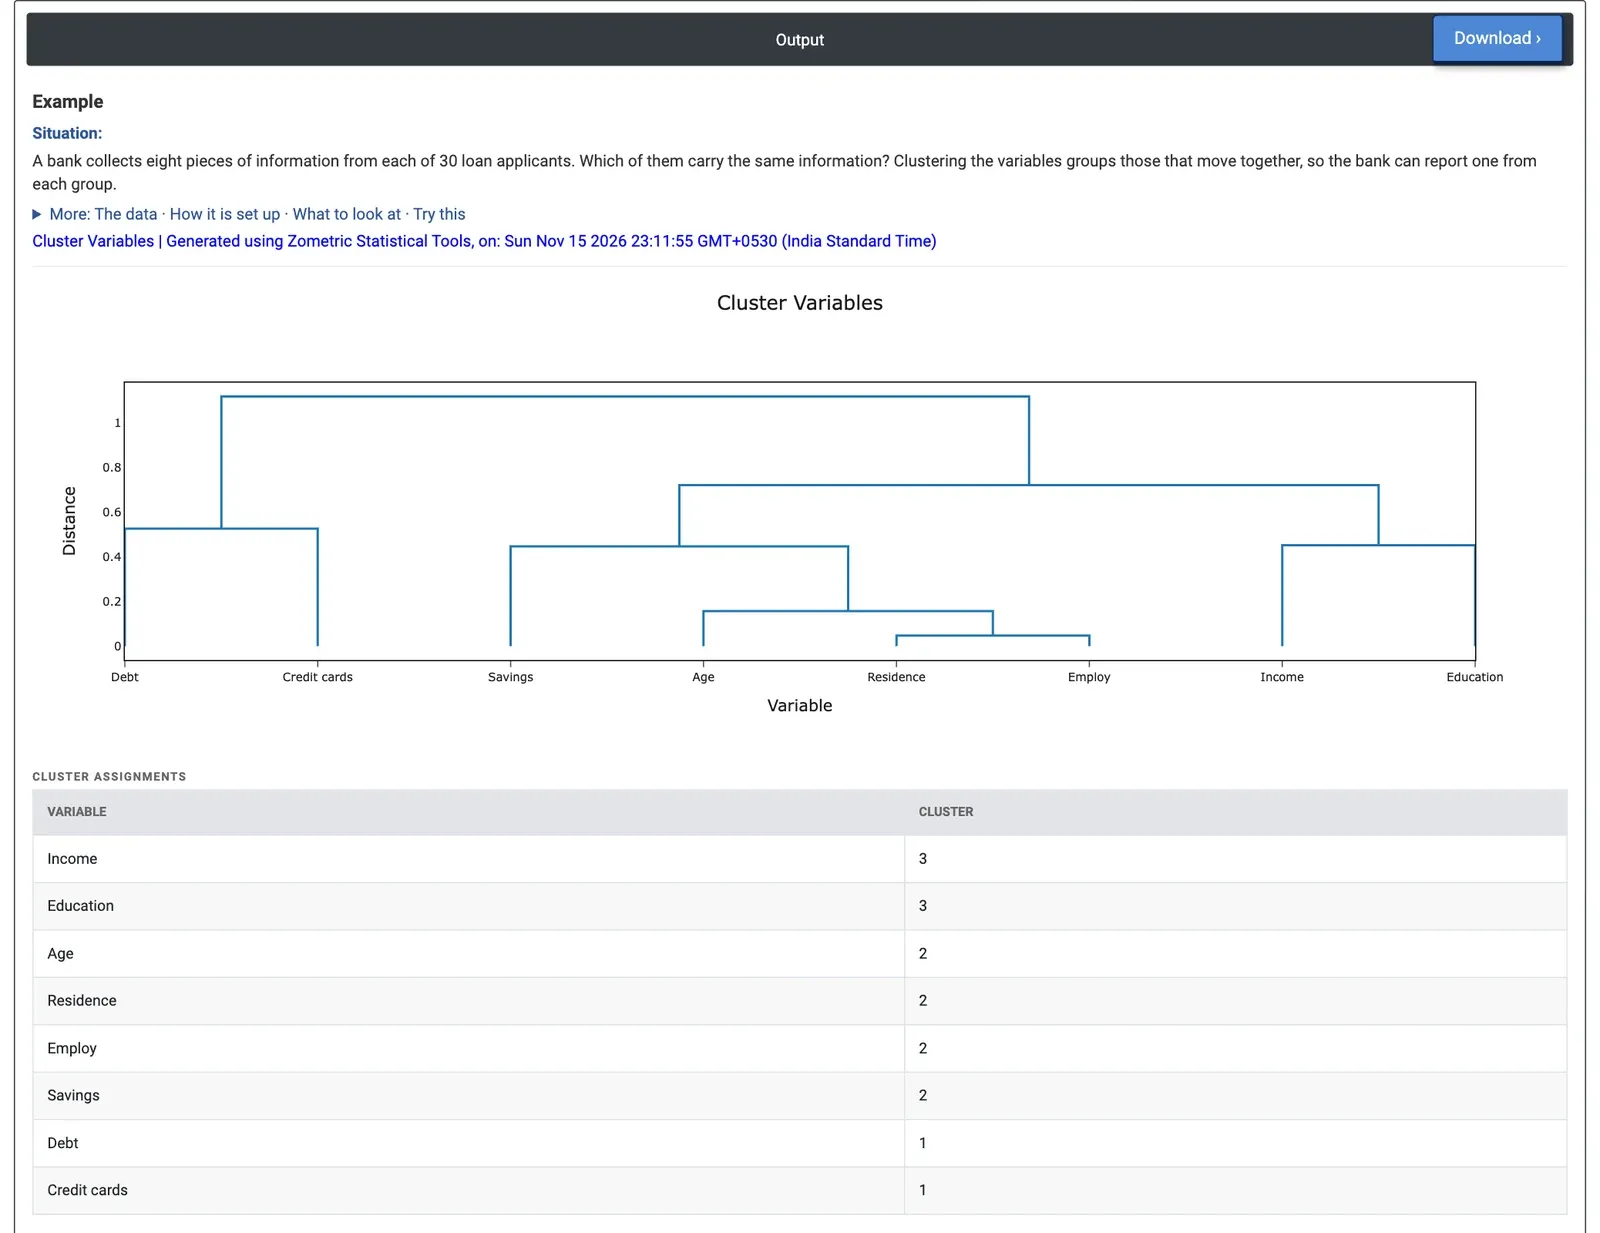
Figure 2 — Dendrogram and cluster assignments for the eight loan-applicant variables: stability, income and borrowing clusters.
Worked Example
A bank records eight pieces of information on each loan applicant: income, years of education, age, years at the current address (Residence), years with the current employer (Employ), savings, debt and number of credit cards. A credit analyst wants to know which of them carry the same information, so that a short report can show one from each group. Using 30 applicants, the analyst selects all eight columns, keeps Linkage method = Average and Distance measure = Correlation, and enters Number of clusters = 3.
Residence and Employ join first, at a distance of 0.048 (correlation 0.95), and Age joins them at 0.157. Savings joins this group at 0.446. Income and Education join at 0.451, and Debt and Credit cards at 0.526. With three clusters, Cluster 2 holds Age, Residence, Employ and Savings, which describe the applicant's stability; Cluster 3 holds Income and Education; and Cluster 1 holds Debt and Credit cards, the borrowing. The last two joins come at 0.72 and 1.117, well above the others, which supports three groups.
For the analyst, one variable from each cluster, for example Employ, Income and Debt, would cover most of what the eight variables say. Setting Number of clusters = 2 merges the stability and income clusters and leaves Debt and Credit cards on their own; with 4 clusters, Debt and Credit cards separate. Factor Analysis on the same eight columns gives a similar grouping, with loadings that show how strongly each variable belongs to its group.