
Create Stability Study Worksheet
On this page
Purpose
Create Stability Study Worksheet builds the data-collection sheet for a stability study before any testing starts. You enter the test times (for example 0, 3, 6, 9, 12, 18 and 24 months), the batches and the number of samples tested per batch at each time, and the tool lists every test in the order it should be run, with an empty Response column to fill in. Use it to plan shelf-life studies of drugs, food, chemicals or packaged products, so that the data come back complete and in the layout the Stability Study tool expects.
Key Capabilities
- Test times at varying intervals that you type, or at equal intervals from a start time and an interval.
- Your own unit of time (Month, Week, Day …) used as the column heading.
- Batch names you choose, and 1 to 50 samples (repeats) per batch per test time.
- Four run orders: no randomization, grouped by batch, or the batch order (and repeats) randomized within each test time.
- A base for the random number generator to make the random order reproducible.
- Summary of the design (batches, time points, repeats, total rows), and PDF or Excel export of the worksheet with an optional report date and name.
Statistical Methods
The worksheet has one row for every combination of test time, batch and repeat, so the number of rows is batches × test times × repeats. The standard order runs through the test times in turn; within each time, through the batches; within each batch, through the repeats. Do not randomize keeps that order. Do not randomize, group repeats by batch lists all test times for the first batch, then all for the second, and so on. Randomize batch sequence at each testing time, group repeats by batch shuffles the order of the batches separately at each test time and keeps the repeats of a batch together. Randomize batch sequence and repeats at each testing time (the default) shuffles all batch and repeat combinations within each test time. Test times are never shuffled, because each pull happens at its own time.
Randomizing the order within a test time spreads any drift in the test method across the day (instrument warm-up, analyst fatigue, a change of reagent) over all batches, so it is not mistaken for a batch difference. The shuffle uses a seeded generator when a base is entered: the same base and the same settings give the same order again; with no base the order changes on every Generate. As general practice, ICH Q1A(R2) asks for at least three batches and, for long-term studies, testing every 3 months in the first year, every 6 months in the second and yearly after that, which matches the default test times 0, 3, 6, 9, 12, 18, 24, 36 and 48. The filled worksheet is analysed with the Stability Study tool, which fits the response against time for each batch and estimates the shelf life.
Input Fields & Options
Field | Description |
Test times format | Test times in numeric format, at varying intervals (default; edit the values in the Time Points table) or at equal intervals. |
Start time / Interval | Shown with equal intervals. Default 0 and 3: test times 0, 3, 6, … |
Number of test times | Default 9, 2 to 200. Sets the number of rows in the Time Points table. |
Unit of time | Default Month. Used as the heading of the time column. |
Number of batches | Default 3, 1 to 100. Sets the number of rows in the Batches table. |
Samples per batch per time (repeats) | Default 1, up to 50. Number of samples tested for each batch at each test time. |
Time Points | Editable table of the test times. Defaults for varying intervals: 0, 3, 6, 9, 12, 18, 24, 36, 48. Every value must be filled. |
Batches | Editable table of batch names. Default 1, 2, 3 …; every name must be filled. |
Randomization | One of: Do not randomize; Do not randomize, group repeats by batch; Randomize batch sequence at each testing time, group repeats by batch; Randomize batch sequence and repeats at each testing time (default). |
Base for random data generator | Optional whole number. The same base gives the same random order again. |
Store standard order in worksheet | Unticked by default. Adds a StdOrder column giving each row's position in the standard order, so the randomized worksheet can be sorted back. |
Report Date / Reported By | Optional. Included in the PDF and Excel export only. |
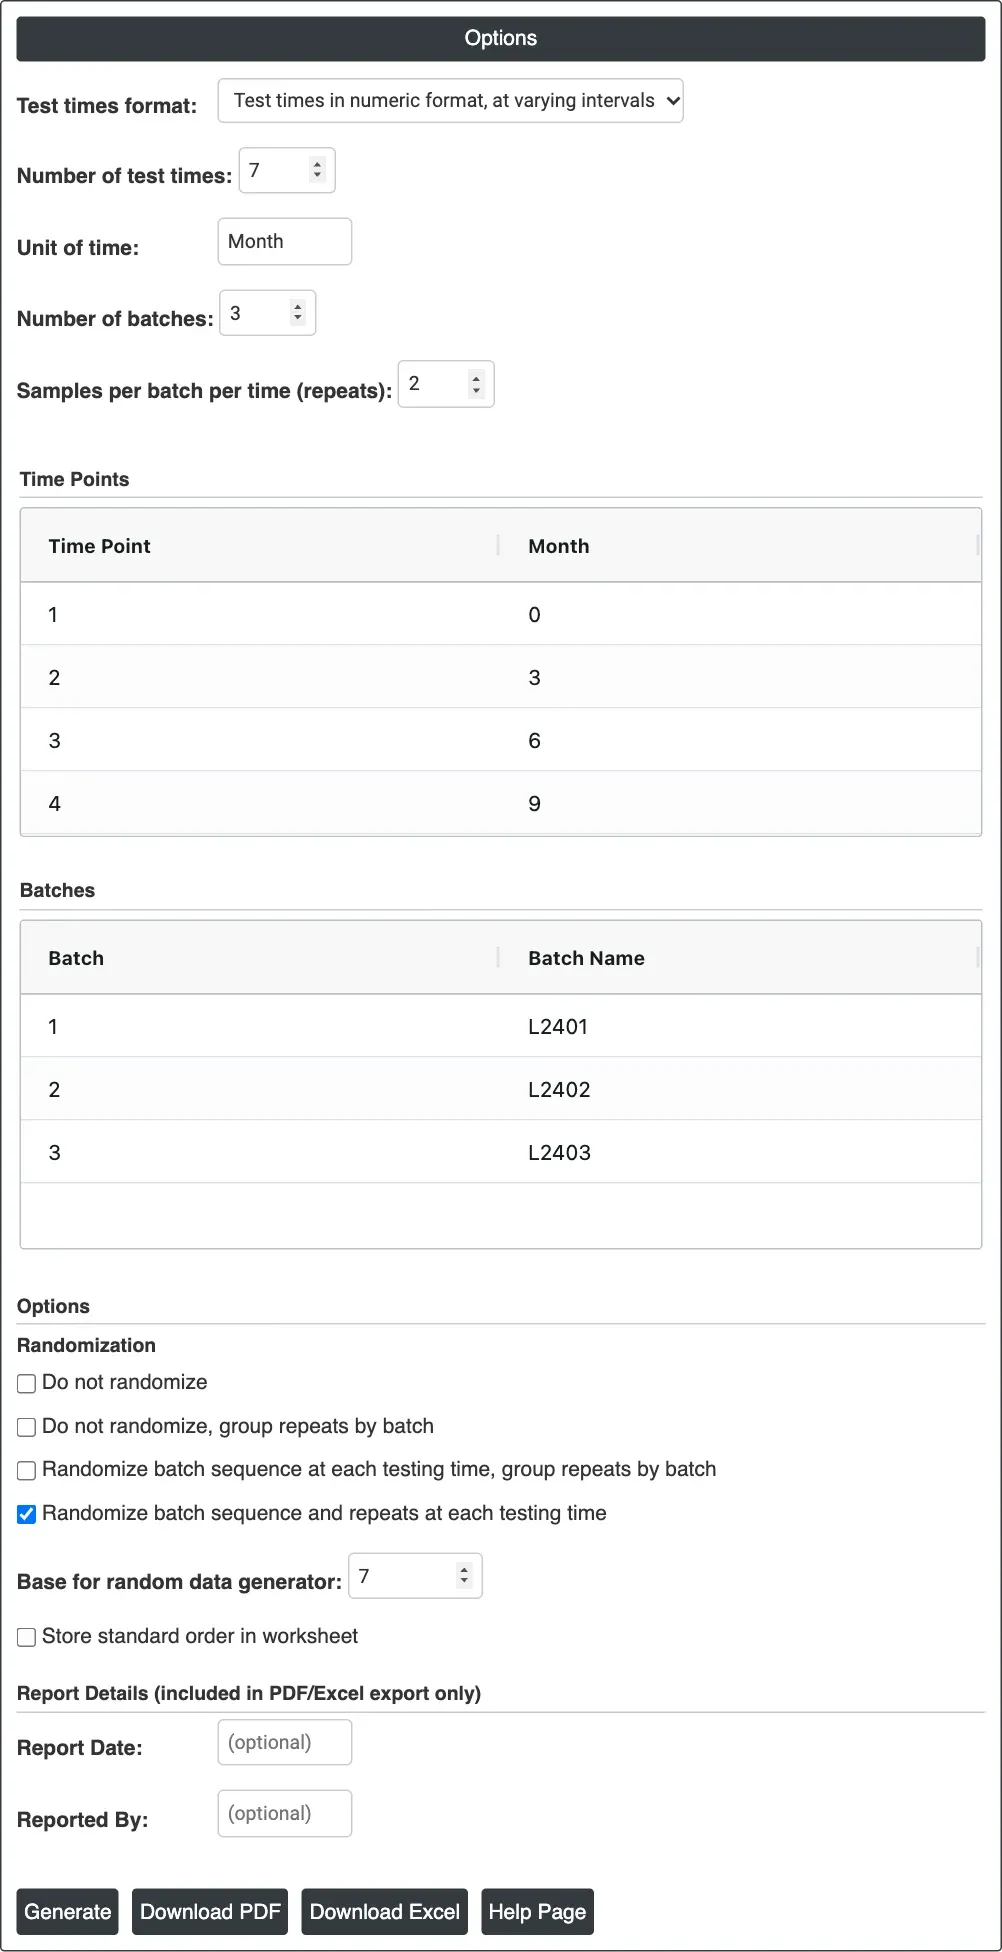
Figure 1 — Options for the example: 7 test times (0 to 24 months), batches L2401, L2402 and L2403, 2 repeats, full randomization with base 7.
Output Descriptions
- Summary table — Batches, Time Points, Repeats per Batch, Measurements per Time Point (batches × repeats), Total Rows, Randomization and Store Standard Order.
- Stability Study Worksheet — the run order: Batch, the time column (named by the unit of time), an empty Response column to fill in, and, when chosen, StdOrder: each row's position in the standard order.
- Download PDF and Download Excel — the worksheet with the report date and name.
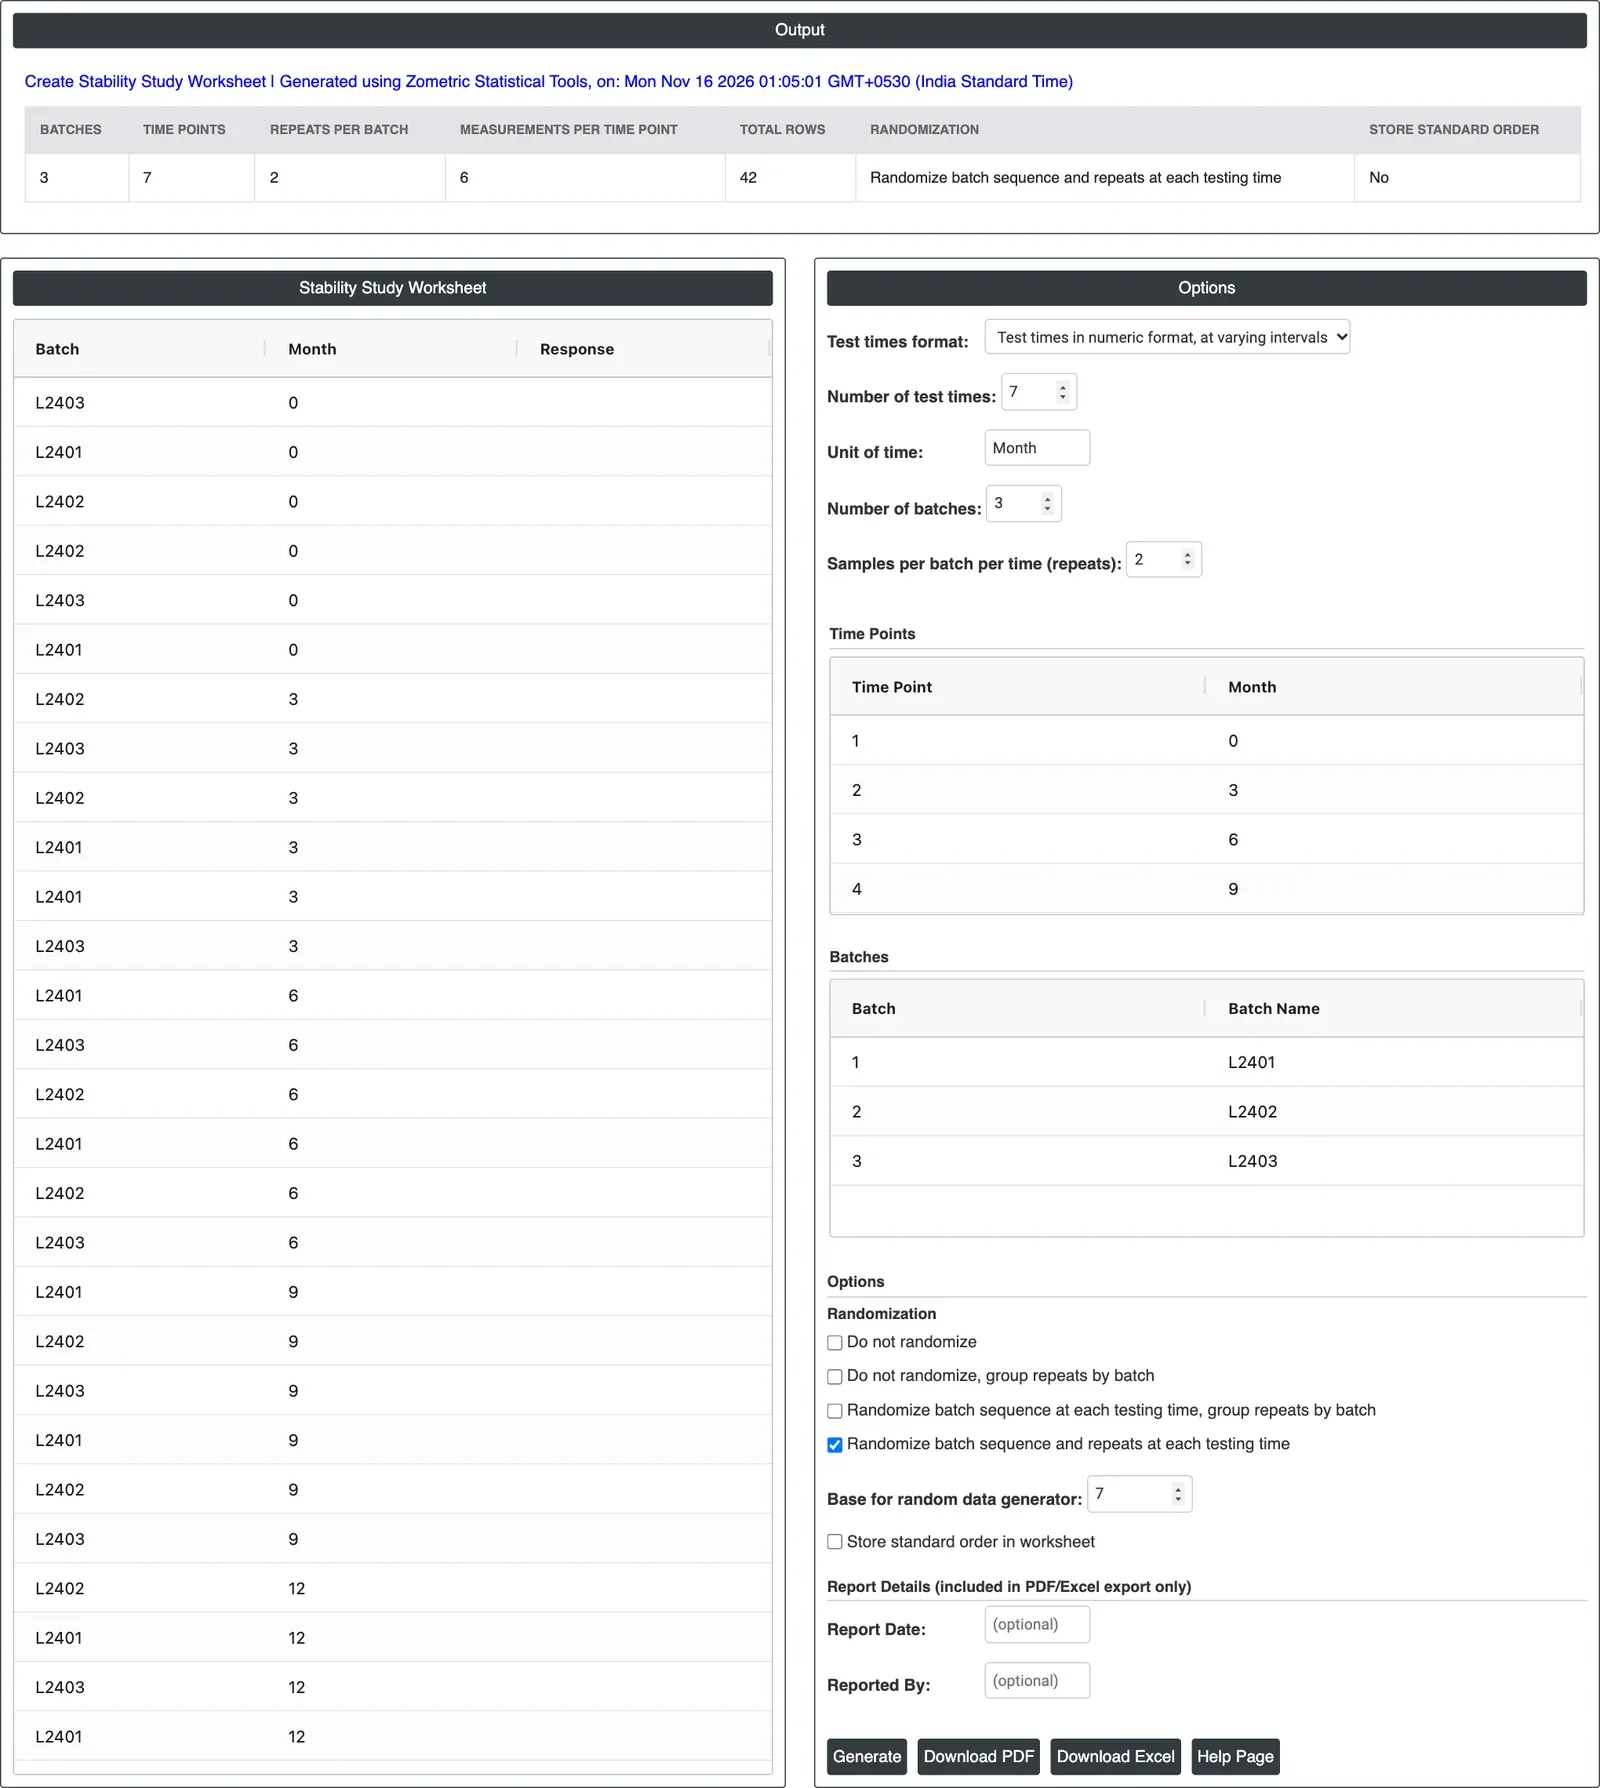
Figure 2 — The 42-row worksheet: at each test time the six tests (3 batches × 2 repeats) are in random order, and the summary confirms 3 batches, 7 time points, 2 repeats per batch and 6 measurements per time point.
Worked Example
A QA analyst plans a 24-month long-term stability study of the assay of a tablet product on three production batches, L2401, L2402 and L2403. Two tablets per batch are to be tested at 0, 3, 6, 9, 12, 18 and 24 months. The analyst keeps varying intervals, sets Number of test times = 7 (the first seven default times are the ones needed), Unit of time = Month, Number of batches = 3 and repeats = 2, types the batch names into the Batches table, keeps full randomization and enters 7 as the base so the plan can be reproduced.
The worksheet has 3 × 7 × 2 = 42 rows. At month 0 the order is L2403, L2401, L2402, L2402, L2403, L2401; at month 3 it is L2402, L2403, L2402, L2401, L2401, L2403. Each month's six tests are in a different random order, so if the assay method drifts during a run, the drift is shared by the batches instead of always hitting the batch tested last. Generating again with base 7 gives exactly the same worksheet, which the analyst records in the study protocol. With Store standard order ticked, the same order gets a StdOrder column; at month 0 it reads 5, 1, 3, 4, 6, 2, the positions of these tests in the standard order (L2401, L2401, L2402, L2402, L2403, L2403).
The analyst adds the report date and name, downloads the worksheet as Excel for the laboratory, and at each pull fills in the Response column in the listed order. When the 24-month results are in, the completed worksheet goes into the Stability Study tool with Batch, Month and Response as its columns to estimate the shelf life.