
Cross Tabulation and Chi-Square
On this page
Purpose
Cross Tabulation and Chi-Square counts how often each combination of two categorical variables occurs in raw records, such as department and satisfaction level, defect type and line, or supplier and pass/fail, and tests whether the two are related. A third variable can split the analysis into layers, for example one table per shift.
Key Capabilities
- Two-way table of counts with row and column totals, built from one row per record.
- For layers: a separate table and test for each value of a third variable.
- Row, column and total percents.
- Pearson chi-square test (on by default) and likelihood-ratio chi-square.
- Expected counts, raw, standardised and adjusted residuals, and each cell's contribution to chi-square.
- Cramér's V-square and Fisher's exact test for 2×2 tables.
- Warning when some expected counts are below 5.
Statistical Methods
Records with a missing value in the row, column or layer variable are left out. For the table of observed counts O with row totals Rᵢ, column totals Cⱼ and total N, the expected count under independence is Eᵢⱼ = Rᵢ·Cⱼ / N. The Pearson statistic χ² = Σ (O − E)² / E (no continuity correction, also for 2×2 tables) and the likelihood-ratio statistic G² = 2 Σ O·ln(O / E) are compared with a chi-square distribution with (r − 1)(c − 1) degrees of freedom. A small p-value means the column mix differs between rows.
To see which cells drive the result: the contribution of a cell is (O − E)² / E; the raw residual is O − E; the standardised residual (O − E) / √E; the adjusted residual (O − E) / √(E(1 − Rᵢ/N)(1 − Cⱼ/N)) is roughly standard normal, so values beyond about ±2 mark cells that clearly differ from independence. Cramér's V-square = χ² / (N·(min(r, c) − 1)) measures the strength of the association from 0 (none) to 1 (complete); with a large sample a weak association can still be significant.
The chi-square approximation needs reasonably large expected counts; the page reports how many cells have an expected count below 5. For a 2×2 table Fisher's exact test gives an exact p-value that does not rely on this approximation. Categories appear in sorted order.
Input Fields & Options
Field | Description |
Rows | Categorical column for the rows of the table. Required. |
Columns | Categorical column for the columns. Required; must differ from Rows. |
For layers | Optional. Produces a separate table and test for each value of this variable. |
Row percents / Column percents / Total percents | Add percentage tables. Off by default. |
Chi-Square test | Pearson chi-square test. Ticked by default. |
Likelihood ratio chi-square | Adds the likelihood-ratio test. |
Expected cell counts / Raw residuals / Standardized residuals / Adjusted residuals / Each cell's contribution to chi-square | Add these tables. Off by default. |
Cramer's V-square statistic | Strength of the association. |
Fisher's exact test for 2x2 tables | Exact p-value; reported only for 2×2 tables. |
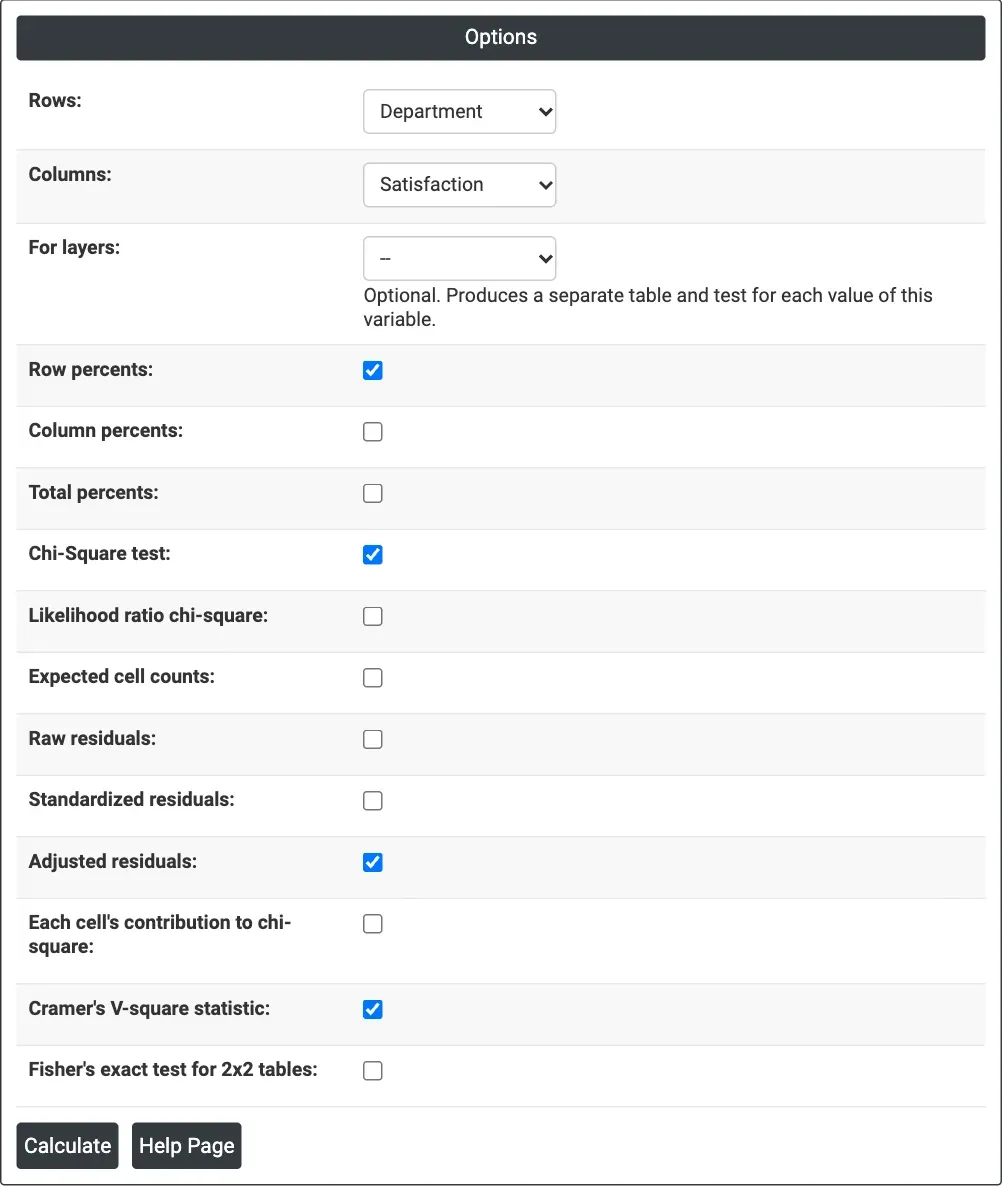
Figure 1 — Options for the survey example: Department as rows, Satisfaction as columns, row percents, the chi-square test, adjusted residuals and Cramer's V-square ticked.
Output Descriptions
- Counts — the table of counts with All totals (one per layer).
- Row percents, Column percents, Total percents, Expected counts, Raw, Standardized and Adjusted residuals, Contribution tables — when ticked.
- Chi-Square Test — Chi-Square, DF and P-Value of the Pearson and likelihood-ratio tests, with a note when expected counts are below 5.
- Other Statistics — Cramer's V-square and Fisher's exact test P-Value.
- PDF export via Download.
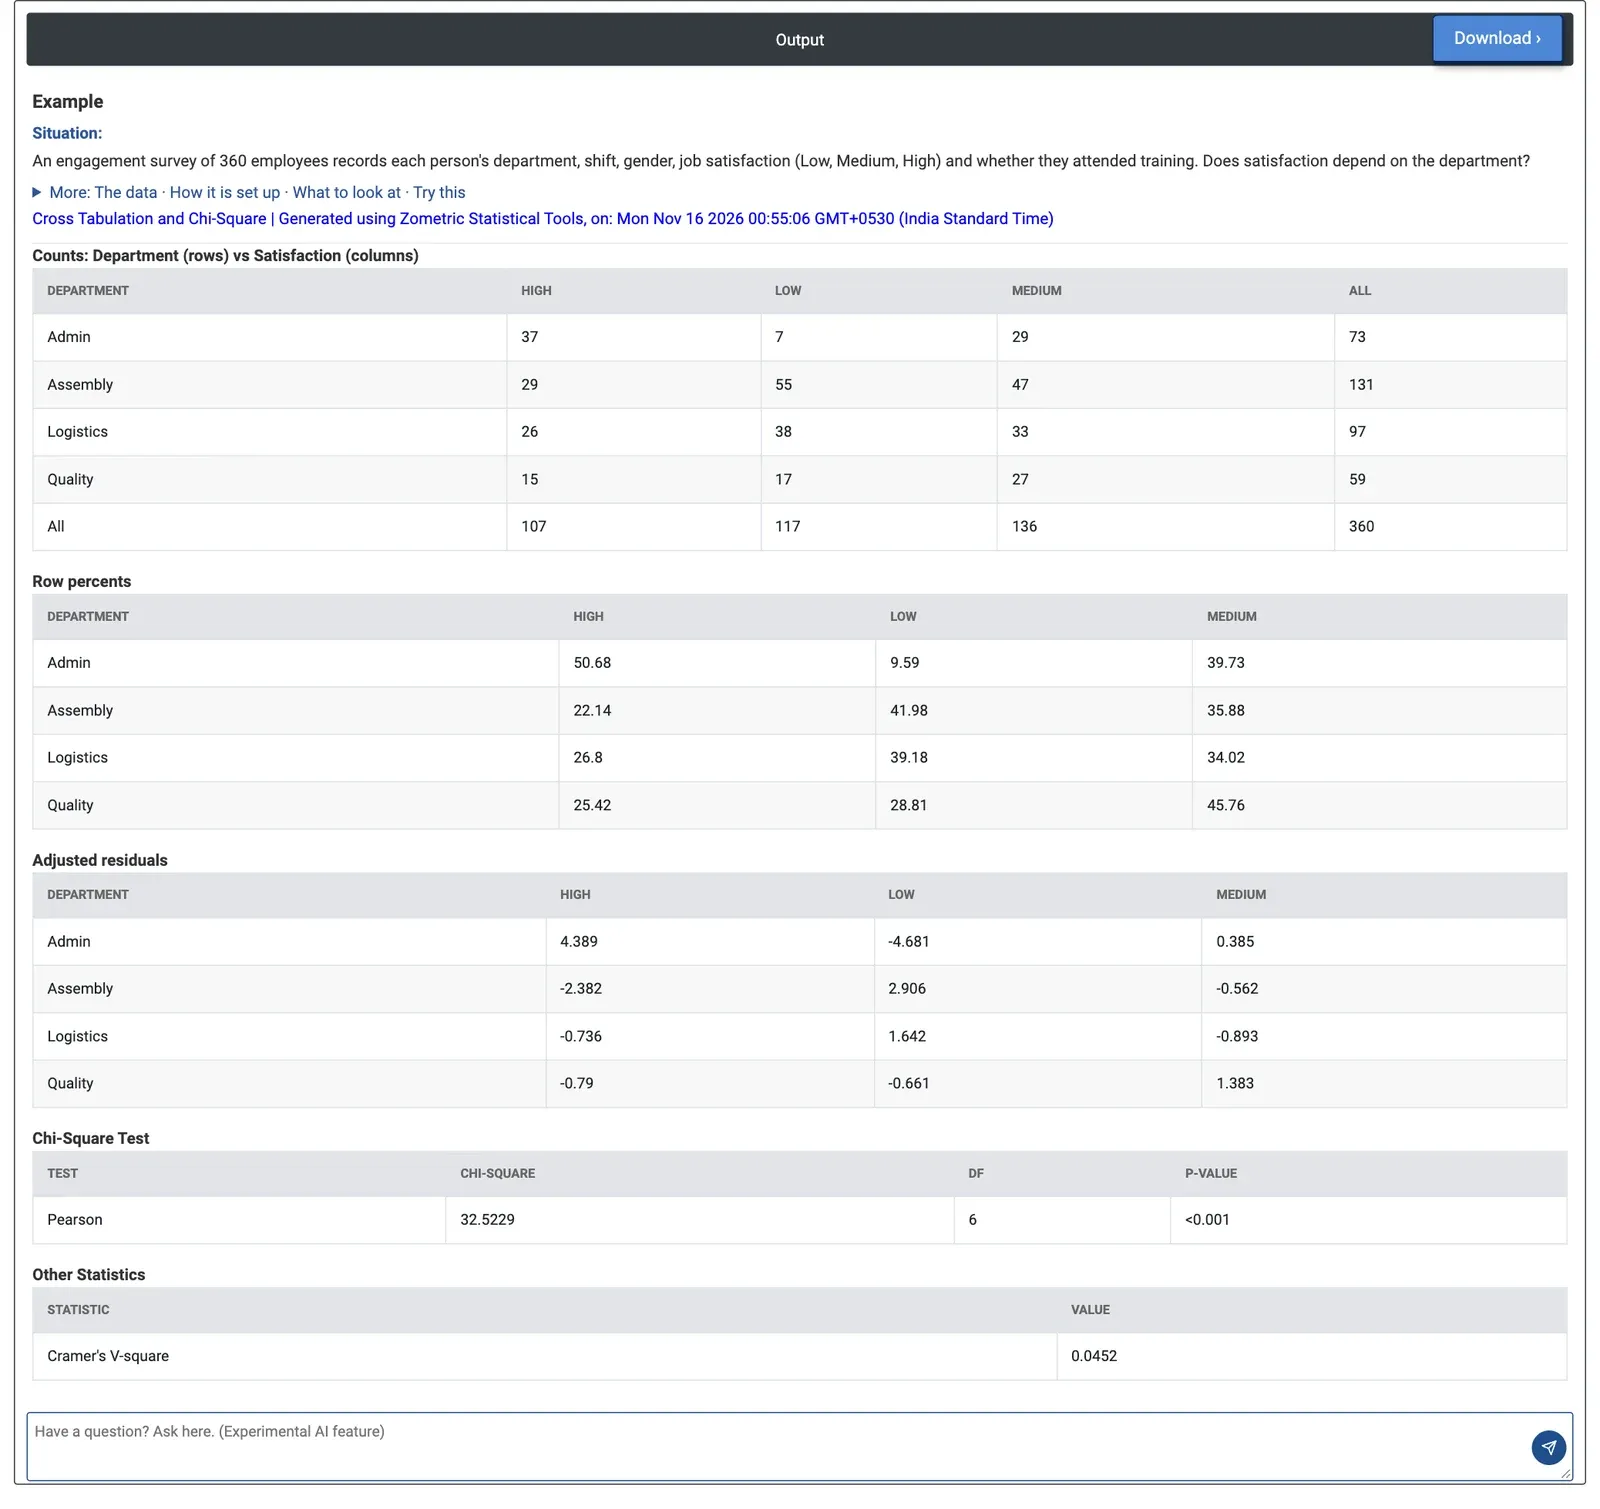
Figure 2 — Satisfaction by department: Pearson chi-square 32.52 with 6 DF, p < 0.001; Admin has the most High ratings and Assembly the most Low.
Worked Example
An engagement survey of 360 employees records each person's department, shift, gender, satisfaction (Low, Medium, High) and whether they attended training. HR wants to know whether satisfaction depends on the department. They choose Department as rows and Satisfaction as columns and tick row percents, adjusted residuals and Cramer's V-square.
Satisfaction does depend on the department: Pearson chi-square 32.52 on 6 DF, p < 0.001. Admin is the most satisfied, with 50.68% High and only 9.59% Low; Assembly the least, with 41.98% Low and 22.14% High. The adjusted residuals beyond ±2 show the cells behind the result: Admin High (+4.389) and Low (−4.681), Assembly Low (+2.906) and High (−2.382). Cramér's V-square is 0.0452: a real but modest association.
Setting For layers to Shift gives one table per shift. On the night shift Logistics has only 4.88% High and 53.66% Low (adjusted residual for High −2.475), against 42.86% High on the day shift, so the night-shift Logistics team is where to start; the night table carries a note that 1 cell has an expected count below 5. Gender against attended training is a 2×2 table: Fisher's exact test gives p = 0.5888, so there is no sign that training attendance differs by gender.