
Data Collection Plan
On this page
Purpose
The Data Collection Plan sets out, before anyone starts measuring, what data a project will collect and how: each measure's operational definition, data type, specification, measurement system, sample size, frequency, stratification and who records it. The tool lays out the plan from the worksheet, reviews it for common gaps, recommends the StatsAI analysis for each measure (including a measurement system study where one is still needed), and builds a blank check sheet for each measure. Use it in the Measure phase, before collecting baseline data.
Key Capabilities
- One worksheet row per measure; columns are recognised by name, so a plan kept in Excel can be pasted in.
- Recommended Analysis per measure: what to check before collecting (Gage R&R or attribute agreement) and which control chart and capability analysis to use, with links to those tools.
- Review Notes that flag missing operational definitions, unvalidated gauges, missing specification limits, small attribute samples and missing owners or frequencies.
- A blank check sheet per measure, laid out for its data type, that opens as a new worksheet with one click.
- Empty plan columns are left out of the printed plan.
- PDF export via Download.
Statistical Methods
The Data type text sets the analysis. Continuous: an I-MR chart for a sample size of 1, an X̄-R chart for 2 to 8 and an X̄-S chart above 8, plus Process Capability (Normal) when an LSL or USL is given. Defectives (pass/fail): a P chart and Binomial Capability. Defects (counts): a U chart and Poisson Capability. Categories: a Pareto chart. If MSA done is not Yes, the plan first recommends a Gage R&R Study (Crossed) for a continuous measure, or an Attribute Agreement Analysis otherwise, because data from an unvalidated gauge cannot be trusted.
The review applies these rules to each measure: an operational definition must be given; the data type must be recognised; the measurement system should be validated; LSL must be below USL; a continuous measure that is not marked X needs specification limits for capability; an attribute measure with fewer than 50 units per sample is flagged as small (aim to see several defectives or defects in each sample); a Categories measure needs its categories listed; and every measure needs a Who and a Frequency. The plan is also flagged if no measure is marked Y.
Check sheets: a continuous measure gets Date, Time, one column per stratification factor and one column per reading in the sample; a defectives or defects measure gets Units inspected (pre-filled with the sample size) and a count column; a Categories measure gets a tally sheet with one row per category and one column per day.
Input Fields & Options
Field | Description |
Plan name | Shown in the plan's title. Its help text lists the worksheet columns recognised: Measure (required), Y or X, Operational definition, Data type (Continuous, Defectives, Defects or Categories), Unit, LSL, Target, USL, Measurement system, MSA done, Sample size, Frequency, Stratify by, Categories, Who, Where, How recorded. |
Rows per check sheet | Blank rows (samples) on each data check sheet. Default 25; 1 to 500. |
Days on tally sheets | Day columns on the tally sheet of a Categories measure. Default 5; 1 to 31. |
Create report | Lays out the plan, the recommendations, the review and the check sheets. |
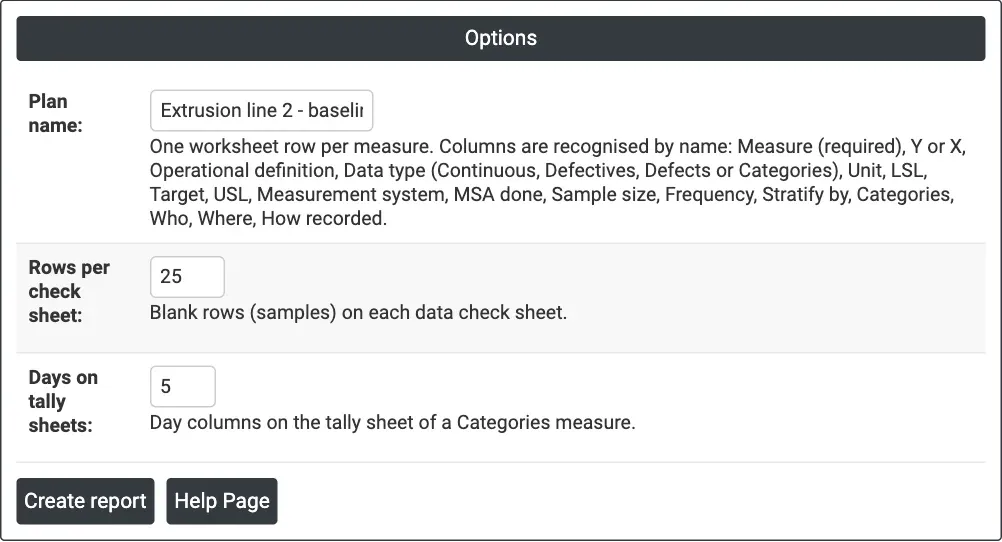
Figure 1 — Options for the example: Plan name = Extrusion line 2 - baseline, with the default 25 rows per check sheet and 5 days on tally sheets.
Output Descriptions
- Data Collection Plan — one row per measure with the columns that have entries: #, Measure, Y or X, Operational definition, Data type, Unit, Specification, Measurement system, MSA done, Sample size, Frequency, Stratify by, Who, Where, How recorded.
- Recommended Analysis — per measure: Data type, Before collecting, Analyse with (links to the tools) and an Open check sheet button.
- Review Notes — the gaps found in the plan (not shown when there are none).
- Check Sheets — a blank check sheet per measure, opened by clicking its name.
- PDF export via Download.
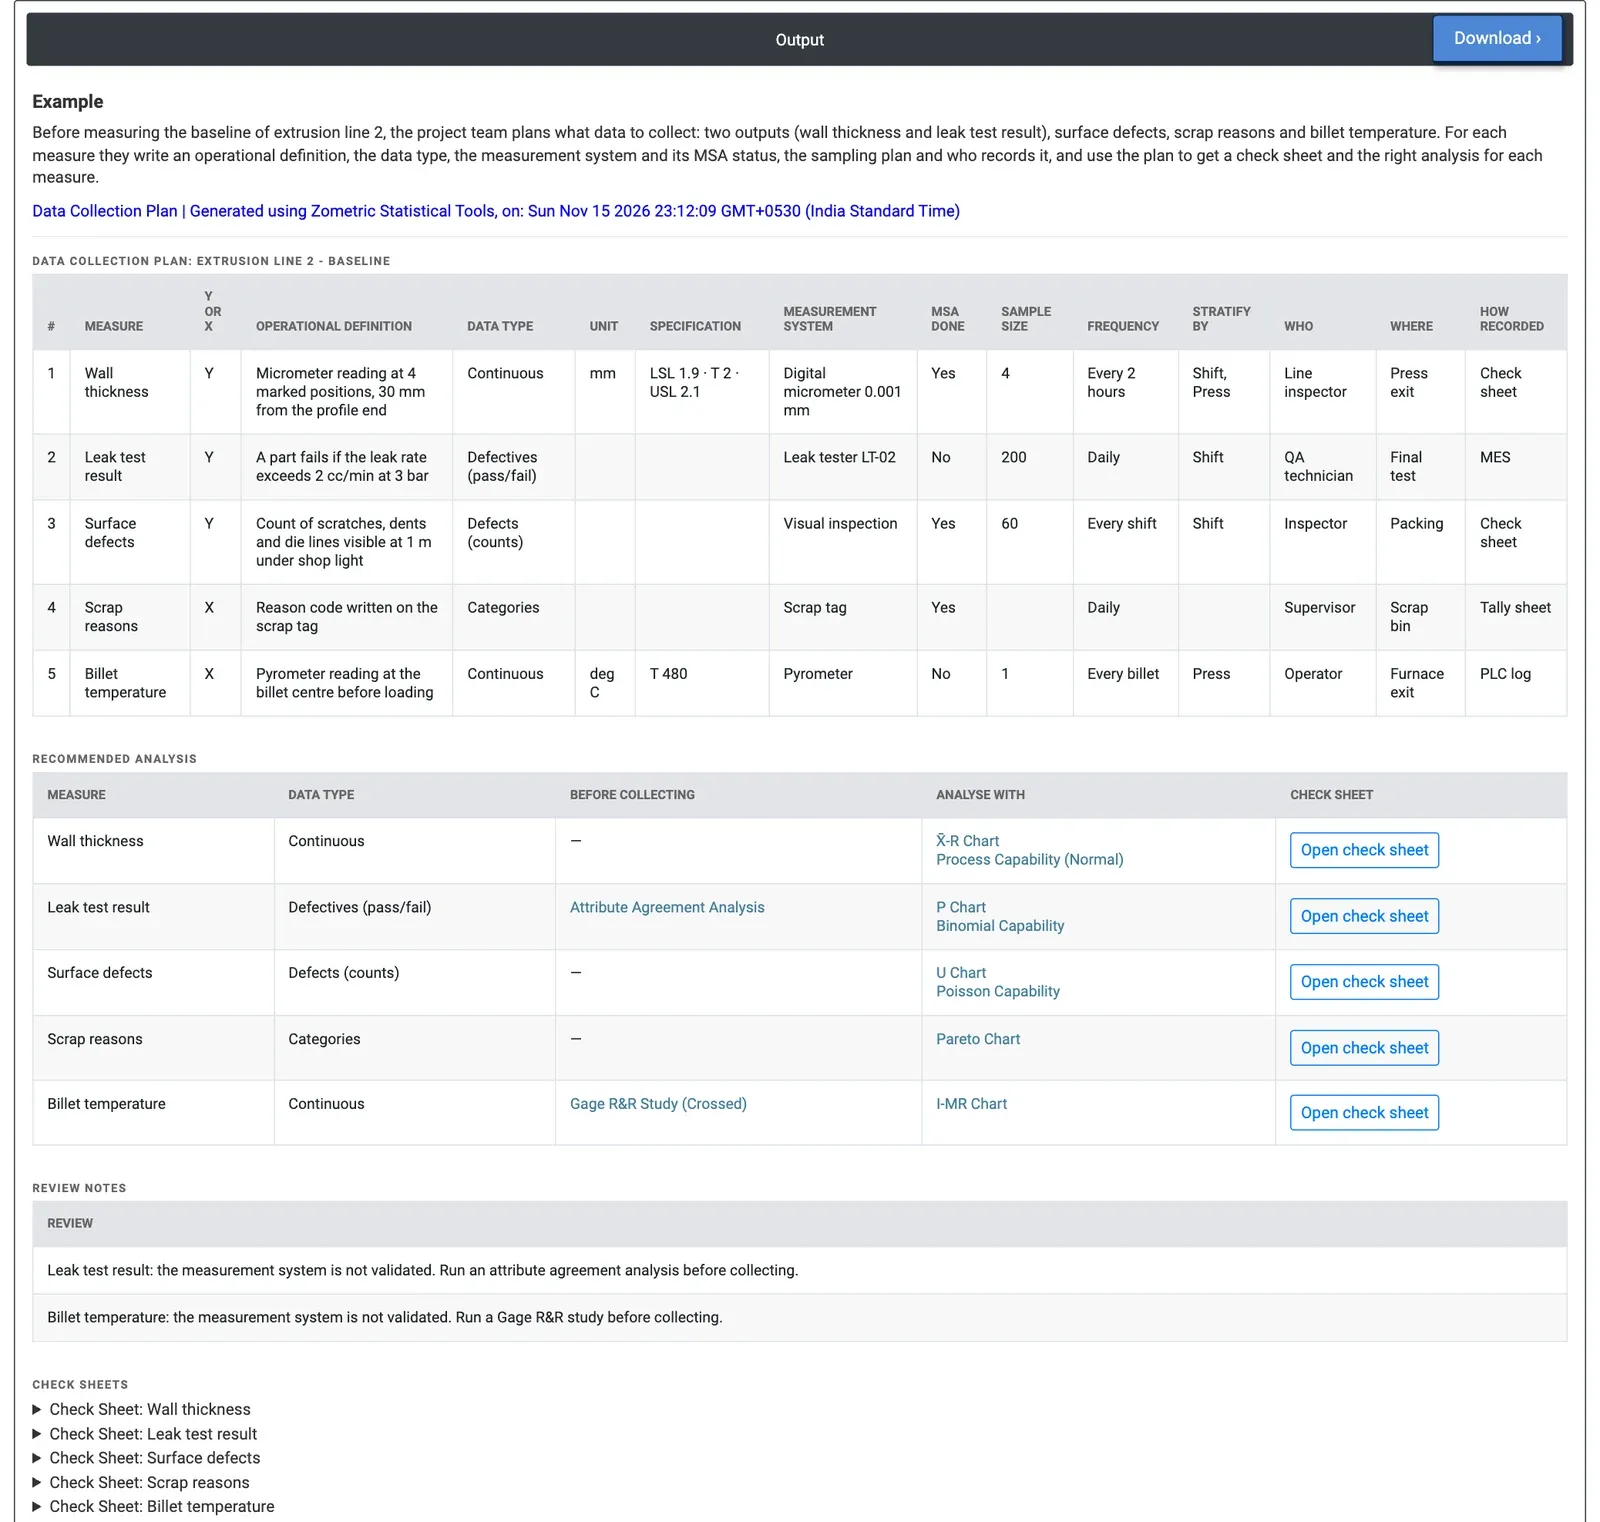
Figure 2 — Data collection plan for the baseline of extrusion line 2: five measures, the analysis for each, and two review notes on gauges that are not yet validated.
Worked Example
Before measuring the baseline of extrusion line 2, the project team plans five measures: three outputs (wall thickness, leak test result, surface defects) and two inputs (scrap reasons, billet temperature). Each row gives the operational definition, data type, specification, gauge, MSA status, sample size, frequency, stratification and who records it.
Wall thickness is continuous, LSL 1.9, target 2, USL 2.1 mm, measured 4 times every 2 hours with a validated micrometer: the tool recommends an X̄-R chart and Process Capability (Normal). The leak test (defectives, 200 parts daily) gets a P chart and Binomial Capability, surface defects (counts, 60 parts per shift) a U chart and Poisson Capability, scrap reasons a Pareto chart, and billet temperature (one reading per billet) an I-MR chart. Two gauges are not validated, and the Review Notes say so: run an attribute agreement analysis on leak tester LT-02 and a Gage R&R study on the pyrometer before collecting. The team schedules those two studies first, then opens the five check sheets as worksheets and hands them to the people named in the Who column.