
Descriptive Statistics (Tables)
On this page
Purpose
Descriptive Statistics (Tables) summarises one or more numeric columns in a single table, broken down by up to two grouping columns: one down the side of the table and one across the top. For every variable you choose which statistics to show: count, mean, standard error of the mean, standard deviation, minimum, quartiles, median and maximum. Use it to put many subgroups side by side before deciding where to look closer, for example fill weights by filler and shift, cycle times by line and product, or test results by supplier and lot. It describes the data; it does not test whether the differences are real.
Key Capabilities
- Several numeric variables in one table, each with its own block of statistics.
- Breakdown by a row variable, a column variable, or both: the row variable's groups run down the table and the column variable's groups across it, as in Minitab.
- Nine statistics to choose from; N, Mean, Standard deviation, Minimum, Median and Maximum are ticked by default.
- Missing values in a variable are left out of that variable's statistics.
- PDF export via Download.
Statistical Methods
The data are split by the levels of the row variable and the column variable (when given), and the statistics are computed separately within each group and for each variable, after missing and non-numeric values are dropped. Groups appear in sorted order of the grouping values. With no grouping variable, the table has one row for the whole column.
N is the number of non-missing values. Mean x̄ = Σx / N. Standard deviation s uses the N − 1 divisor: s = √(Σ(x − x̄)² / (N − 1)). SE of mean = s / √N, the uncertainty of the group mean. Minimum, Median and Maximum are the smallest, middle and largest values. The first and third quartiles are the 25th and 75th percentiles found by linear interpolation between the sorted values at position 1 + (N − 1)·p, so they can differ slightly from software that uses the (N + 1)·p rule. With small groups (fewer than about 10 values) the standard deviation and quartiles are rough, so read them with care.
Input Fields & Options
Field | Description |
Variables | Required. One or more numeric columns to summarise (hold Ctrl or Cmd to select several). |
For rows (optional) | Grouping column. Each of its levels gets its own rows in the table. |
For columns (optional) | Second grouping column. Its levels become the columns of the table, one per level; each row then holds one statistic of one variable (for each level of the row variable, when set). |
N / Mean / SE of mean / Standard deviation / Minimum / First quartile / Median / Third quartile / Maximum | Statistics to show for each variable. Ticked by default: N, Mean, Standard deviation, Minimum, Median and Maximum. At least one must be ticked. |
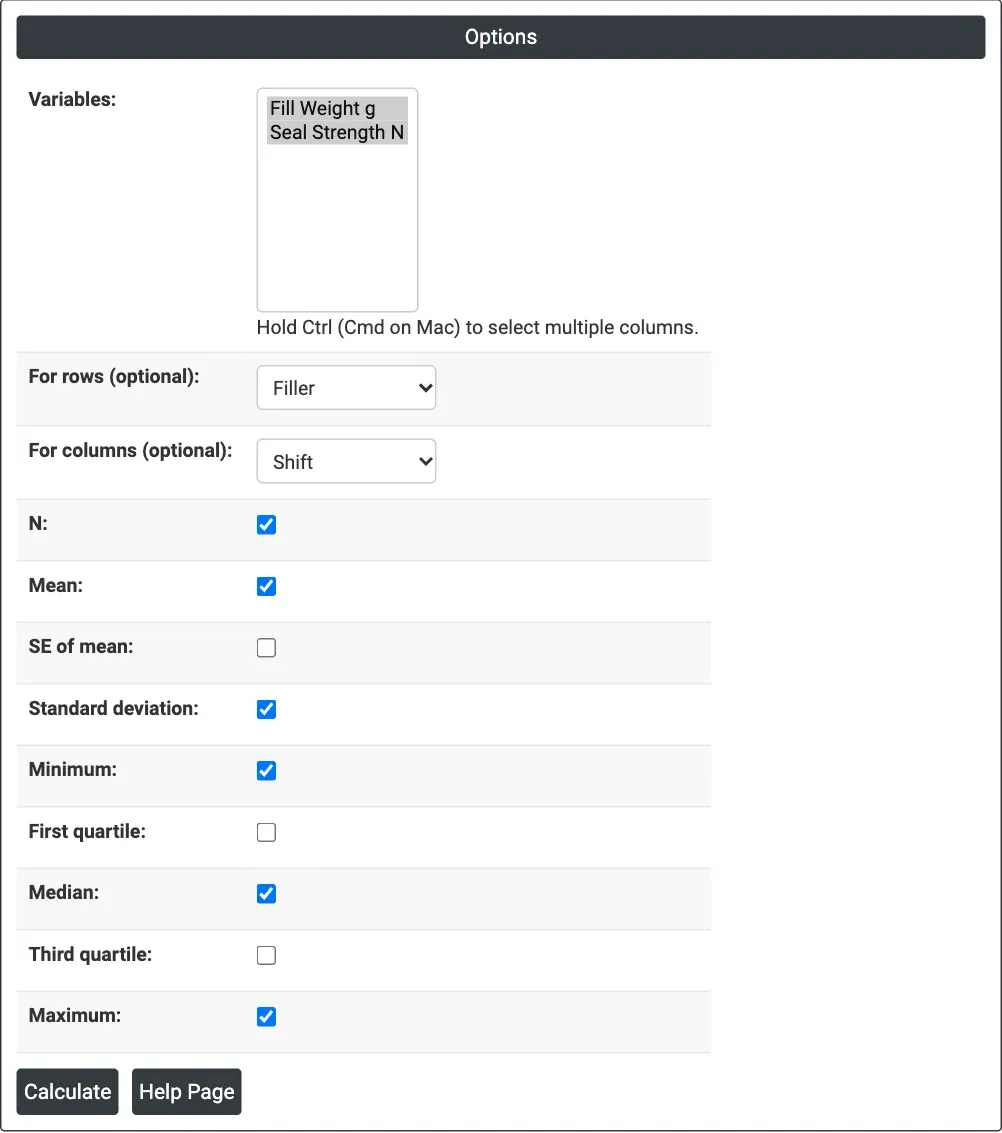
Figure 1 — Fill Weight g and Seal Strength N summarised by Filler (rows) and Shift (columns) with the default statistics.
Output Descriptions
- Statistics table — with a column variable (headed “Rows: <row variable>; Columns: <column variable>”): the row variable's level, Variable and Statistic first, then one column per level of the column variable. Without one: one row per group of the row variable (or one row in all), then one column per variable and statistic, named Variable_Statistic, e.g. Fill Weight g_Mean, Seal Strength N_StDev (Q1, Q3 and SE Mean for the optional statistics).
- PDF export via Download.
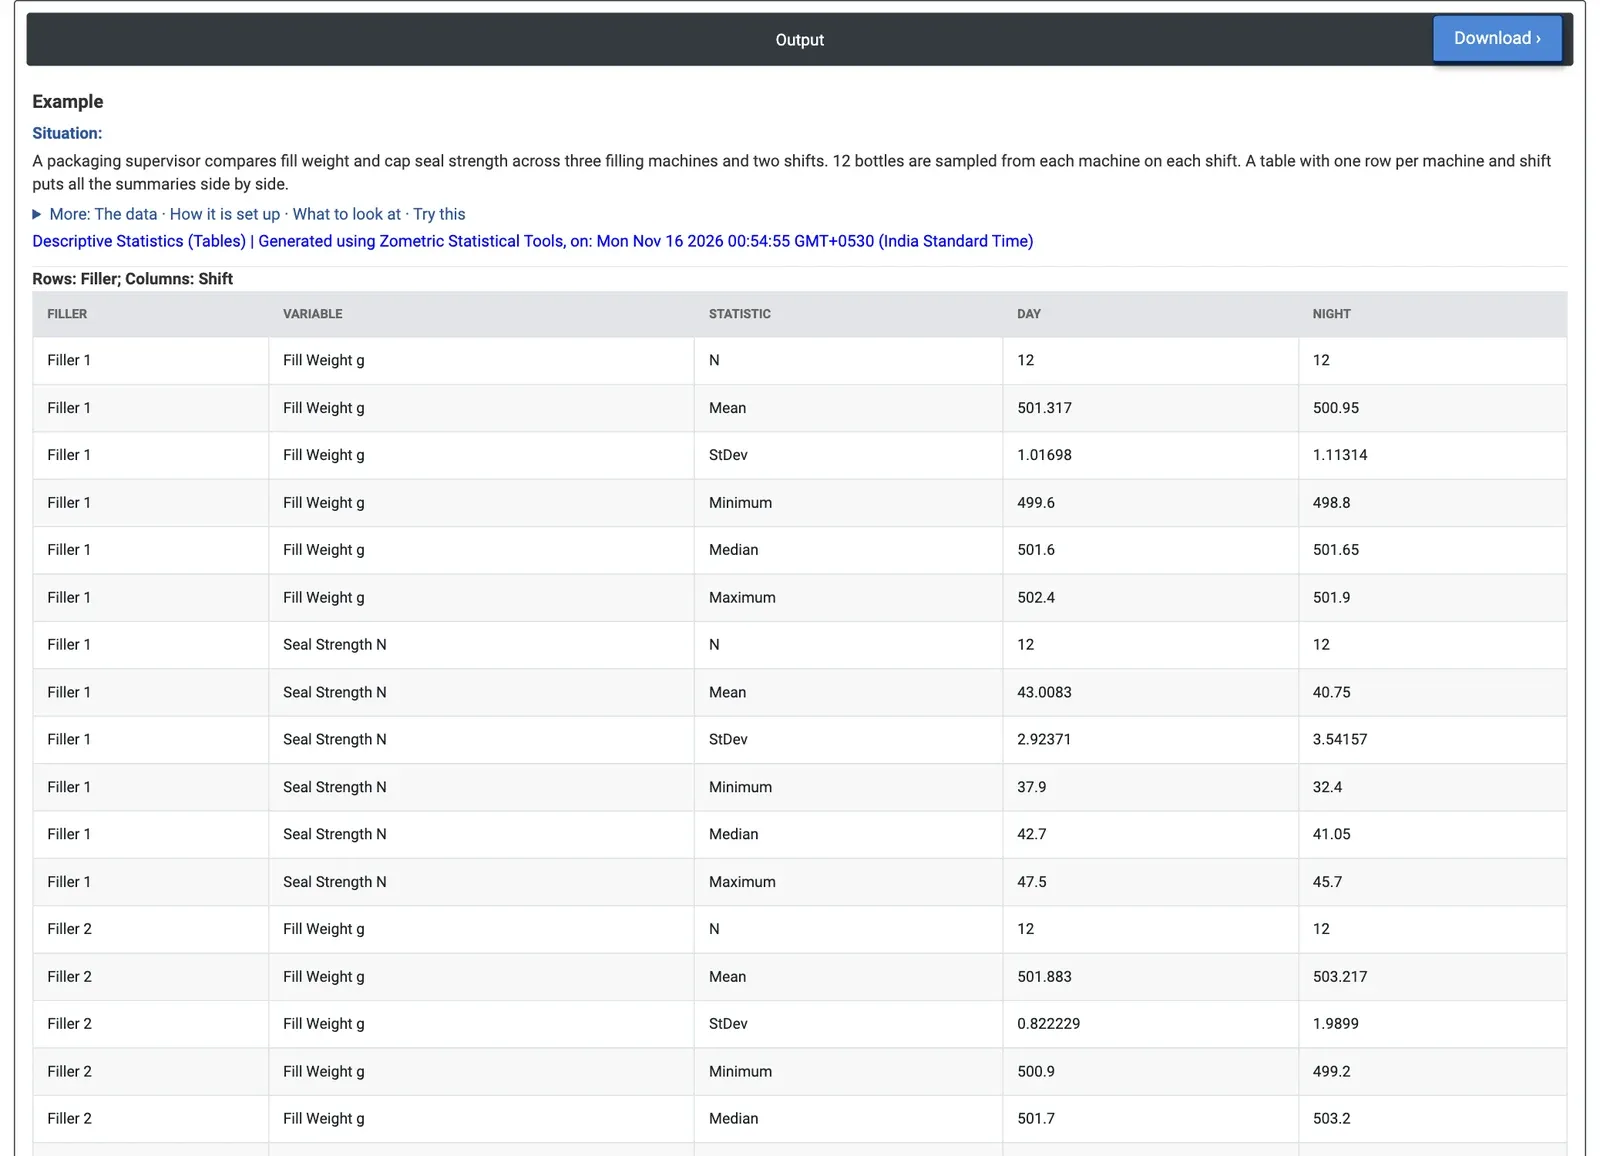
Figure 2 — Fillers down the side and shifts across the top: seal strength is lower on Night shift for all three fillers, and Filler 2 on Night shift fills heaviest and most variably.
Worked Example
A packaging supervisor compares three filling machines over two shifts. Twelve bottles are sampled from each filler on each shift (72 in all), and each bottle's fill weight (g) and cap seal strength (N) are measured. The supervisor selects Variables = Fill Weight g and Seal Strength N, For rows = Filler and For columns = Shift, and keeps the default statistics.
Seal strength is lower on Night shift for every filler: means of 40.75, 38.93 and 38.66 N at night against 43.01, 43.38 and 43.23 N by day. The pattern is the same on all three machines, which points to something on the shift (crew, cap batch, torque setting) rather than one machine. Fill weight tells a different story: Filler 2 on Night shift runs heaviest (mean 503.22 g) and is the most variable (standard deviation 1.99 g, range 499.2 to 506.2 g), while Filler 3 runs lightest on both shifts (499.67 and 499.61 g).
For a shift-level view, setting For rows = Shift with no column variable and ticking First quartile and Third quartile gives seal strength means of 43.21 N by day and 39.44 N at night, with the middle half of the night bottles between 37.15 and 41.18 N. The table shows where to look; to check whether the shift and filler differences are larger than chance, the supervisor runs a two-way ANOVA on Seal Strength N with Filler and Shift as factors.