
Discriminant Analysis
On this page
Purpose
Discriminant Analysis builds a rule that assigns items to known groups from measured values. You give it items whose group is known (for example Standard and Premium batches, good and bad parts, or suppliers) and the measurements taken on them; it finds the combination of measurements that best separates the groups and shows how many items the rule classifies correctly. Use it to check whether a grade or type can be told from inspection data, or to build a rule for sorting new items.
Key Capabilities
- Linear or quadratic discriminant functions for two or more groups.
- Prior probabilities equal for all groups, proportional to group sizes, or set by you.
- Confusion matrix of actual against predicted group, with the overall percentage classified correctly.
- Leave-one-out cross-validation for a fairer estimate of how the rule will work on new items.
- Linear classification functions (constant and one coefficient per predictor for each group) for scoring new items.
Statistical Methods
Rows with a missing group or a missing or non-numeric predictor are dropped. The response is treated as a text label, and groups are listed in alphabetical or numeric order. There must be at least 2 groups and more rows than the number of predictors plus the number of groups.
Linear discriminant analysis assumes the predictors follow a multivariate normal distribution in each group with the same covariance matrix. It estimates each group mean x̄g and a pooled within-group covariance matrix S, and gives each group a score Lg(x) = x̄gᵀ S⁻¹ x − ½ x̄gᵀ S⁻¹ x̄g + ln(pg), where pg is the group's prior probability. An item is assigned to the group with the highest score. The Linear Discriminant (Classification) Functions table lists, for each group, the constant (−½ x̄gᵀ S⁻¹ x̄g + ln pg) and the coefficients S⁻¹ x̄g. Quadratic discriminant analysis drops the equal-covariance assumption and estimates a separate covariance matrix for each group, giving curved boundaries; it needs more data per group and has no simple classification functions.
Prior probabilities are 1/k for k groups by default. Proportional priors use each group's share of the data, which favours larger groups. Resubstitution accuracy classifies the same items the rule was built from and is optimistic. Leave-one-out cross-validation removes each item in turn, builds the rule from the rest and classifies the removed item, so it is a better guide to accuracy on new items.
Input Fields & Options
Field | Description |
Response (grouping variable) | Required. Categorical column holding the known group of each item. |
Predictors | One or more numeric columns used to separate the groups. |
Discriminant function | Linear (default; common covariance matrix) or Quadratic (one covariance matrix per group). |
Prior probabilities | All groups equal (default), Proportional to group sizes in the data, or User-specified. |
Custom priors | Only used when Prior probabilities is User-specified. One value per group, comma or space-separated, in alphabetical or numeric group order; all positive and summing to 1, e.g. 0.2, 0.5, 0.3. |
Cross-validate (leave-one-out) | Ticked by default. Adds the cross-validated accuracy and confusion matrix. |
Title | Title of the analysis. Default Discriminant Analysis. |
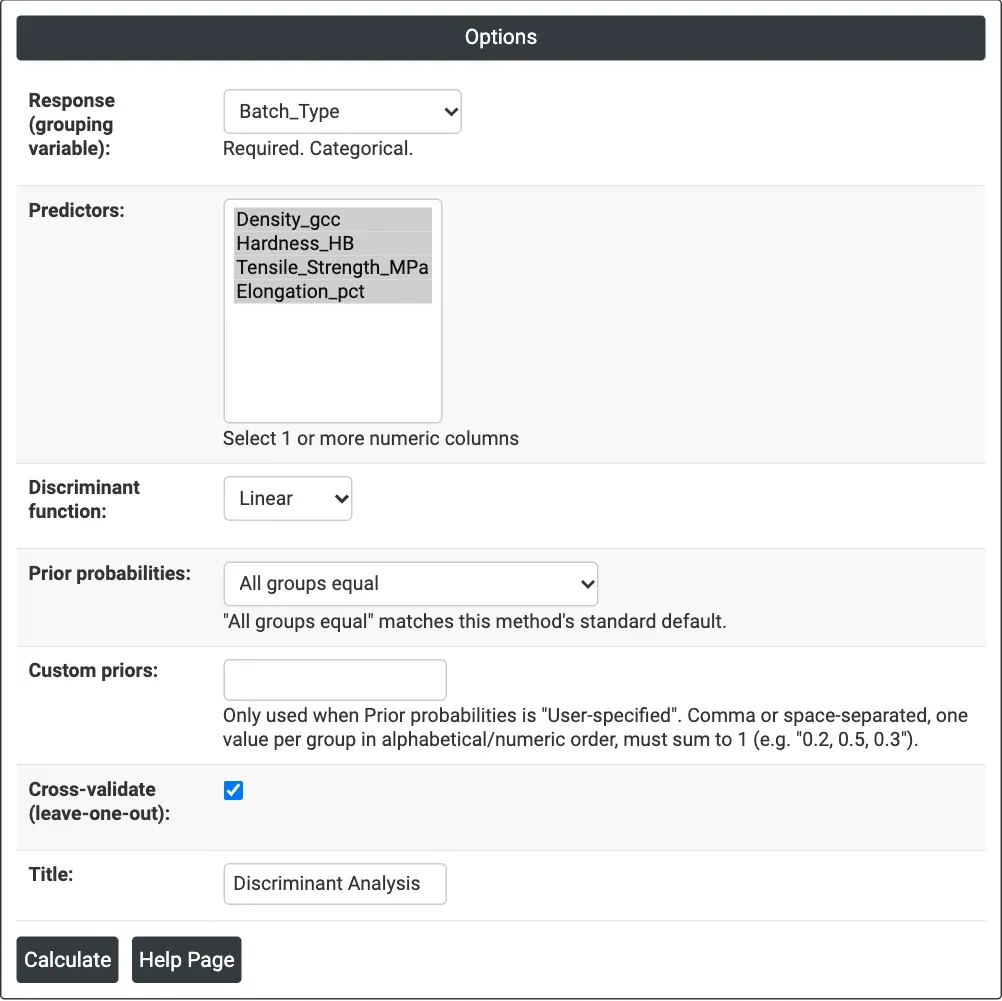
Figure 1 — Options for the example: Batch_Type as the response, four property columns as predictors, linear function, equal priors, leave-one-out cross-validation.
Output Descriptions
- Summary line — N used, resubstitution accuracy and, when ticked, cross-validated (leave-one-out) accuracy.
- Prior Probabilities — the prior used for each group.
- Confusion Matrix (Resubstitution) — actual group in rows, predicted group in columns.
- Confusion Matrix (Cross-Validated) — the same with leave-one-out predictions.
- Linear Discriminant (Classification) Functions — for a linear function only: the constant and the coefficient of each predictor for each group. A new item goes to the group whose function gives the highest value.
- PDF export via Download.
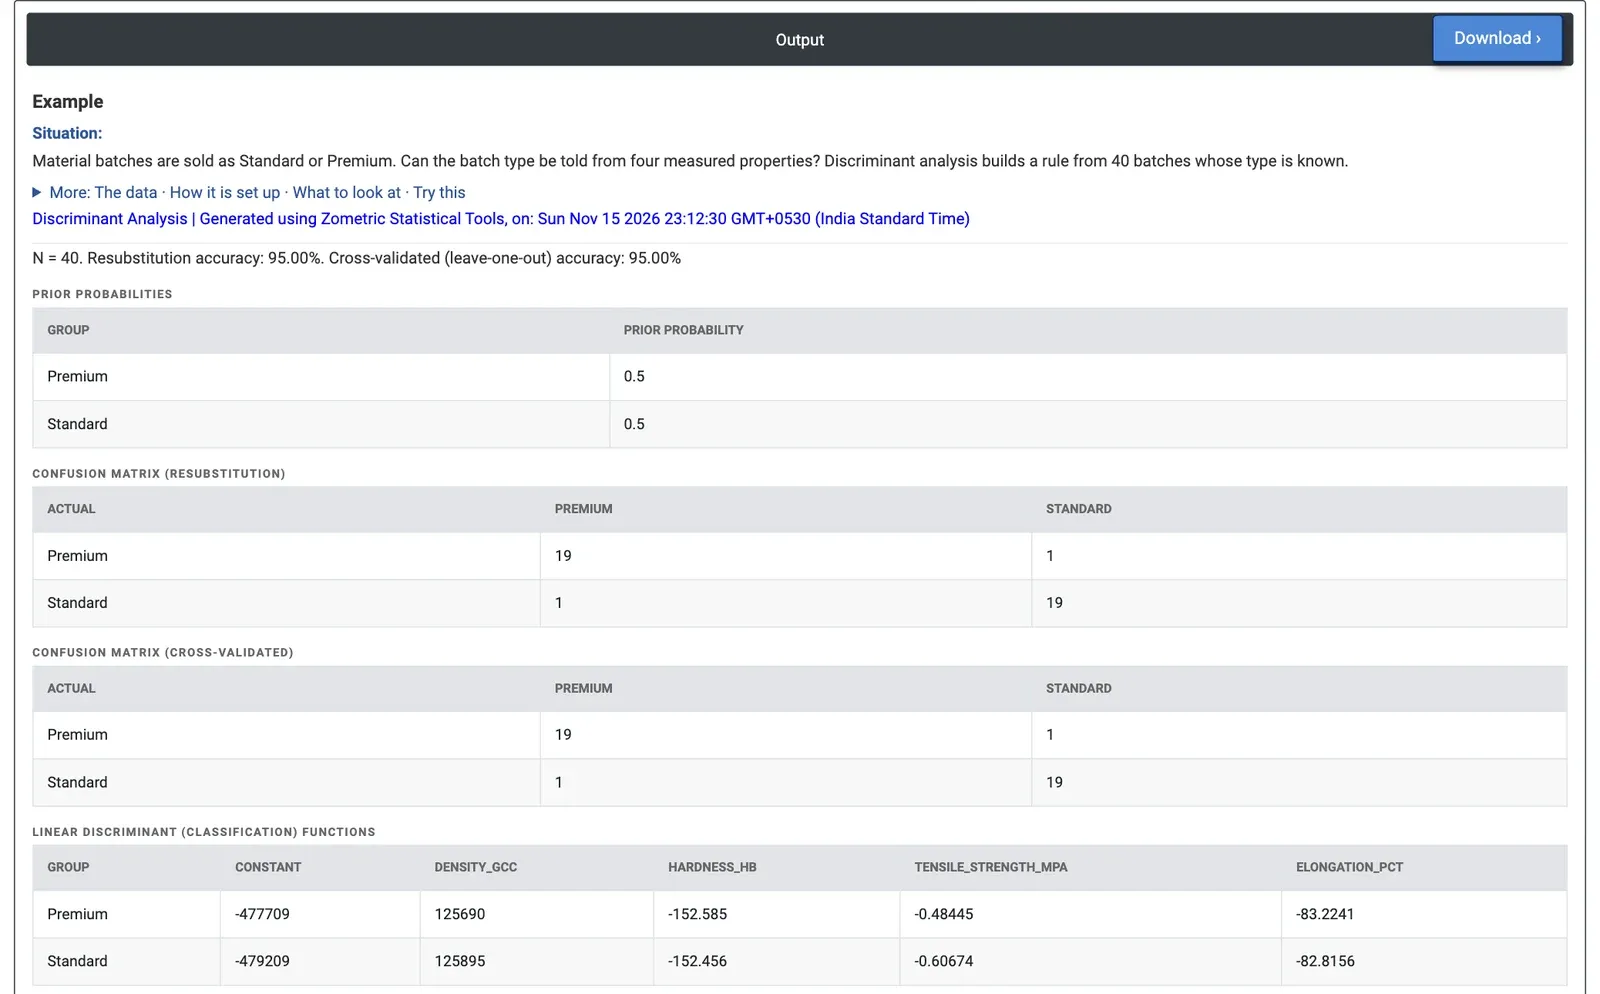
Figure 2 — Results for 40 batches: 95% classified correctly, both on the data and with leave-one-out cross-validation; one batch of each type is misclassified.
Worked Example
A materials plant sells batches as Standard or Premium. The quality engineer wants to know whether the batch type can be told from four routine measurements: density (g/cc), hardness (HB), tensile strength (MPa) and elongation (%). The engineer uses 40 batches whose type is known, 20 of each, and sets Response (grouping variable) = Batch_Type, the four properties as Predictors, Discriminant function = Linear, Prior probabilities = All groups equal and Cross-validate ticked.
The rule classifies 38 of 40 batches correctly: 95.00% on the data and 95.00% with leave-one-out cross-validation, so it is not just fitting the 40 batches it was built from. In each type 19 of 20 are correct. The two misclassified batches are row 3 (Standard, 197.4 HB, 1,210.8 MPa) and row 27 (Premium, 202.3 HB, 1,209.7 MPa): they sit between the group means (Premium 212.9 HB and 1,253.6 MPa, Standard 180.1 HB and 1,126.2 MPa) and are worth checking. The classification functions give each new batch a Premium score and a Standard score from its four measurements, and the batch is assigned to the type with the higher score.
Density matters more than its small spread suggests: the Premium mean is 7.878 g/cc against 7.850 for Standard, and with density removed from the predictors accuracy drops to 82.5% (75.0% cross-validated). A quadratic function does worse here, 92.5% on the data and 85.0% cross-validated, because it estimates more parameters from only 20 batches per group. For the engineer, the linear rule on all four properties is good enough to flag batches whose label does not match their measurements. Compared with clustering the same data without the labels (Cluster K-Means matches the types for 28 of 40), knowing the groups gives a much clearer separation.