
Dotplot
On this page
Purpose
A Dotplot shows every value of a small or medium data set as a dot along a number line, with dots of similar value stacked on top of each other. Unlike a mean and standard deviation, it shows the shape of the data: where the values pile up, gaps, separate groups and stray points. Use it for samples of up to a few hundred values, for example fill volumes, dimensions from a first-off check or test results from a trial, before you summarise them or run a test that assumes a normal distribution.
Key Capabilities
- One data column, or several columns (Multiple Ys mode), each in its own row and colour.
- Optional grouping column: one row of stacked dots per group, as in Minitab's With Groups dotplot.
- Number of bins set by you or calculated from the sample size.
- Log scale X-axis for skewed, positive data.
- Optional exclusion of outliers by the 1.5×IQR rule, with a note of how many were removed.
- Data Options to exclude rows, or keep only rows, by row number or by a condition.
Statistical Methods
The values are converted to numbers and missing or non-numeric entries are dropped. The range from the smallest to the largest value is divided into equal bins; when Number of bins is blank, the number is 2 × √n rounded up, kept between 10 and 60 (10 bins for 25 values). Each value is placed at the centre of its bin, and values in the same bin are stacked one above the other, so the height of a stack is the count in that bin. Dots therefore show values to the nearest bin, not exactly; the largest value goes into the last bin. With a grouping column, or several data columns, each group or column gets its own row (the first at the top), and all rows share the same bins, so the rows can be compared directly. With Log scale X-axis the bins are equal on the logarithmic scale; all values must then be above zero.
With Exclude outliers ticked, values below Q1 − 1.5×IQR or above Q3 + 1.5×IQR (IQR = Q3 − Q1, worked out per group when a grouping column is set) are removed before plotting, and a note below the graph says how many. Reading the plot: one central heap that tails off evenly on both sides is consistent with a normal distribution; two or more heaps with gaps between them suggest a mix of sources (two nozzles, two shifts, two suppliers) that is worth splitting before any further analysis.
Input Fields & Options
Field | Description |
Data column(s) | Required. One numeric column, or several for Multiple Ys mode. Hold Ctrl or Command to select several. |
Grouping column | Optional. One row of stacked dots per group, each in its own colour and named on the vertical axis ("With Groups"). |
Number of bins | Optional, 5 to 200. Leave empty to calculate it from the number of values. |
Log scale X-axis | Unticked by default. Uses a logarithmic X axis and equal bins on that scale. |
Title | Title shown on the graph. Default Dotplot. |
Discrete color sequence | Palette for the groups or columns, default D3. A single column without groups is drawn in navy. |
Exclude outliers (1.5×IQR rule) | Unticked by default. Drops points beyond Q1 − 1.5×IQR and Q3 + 1.5×IQR (per grouping column, when set) before plotting. |
Data Options: Subset (optional) | Exclude matching rows (default) or Include only matching rows, matched by Row numbers (e.g. 3,7,12-15, using the original grid row numbers) and/or a Condition (e.g. Fill_Volume_mL > 249). Has no effect unless Row numbers or Condition is filled in. |
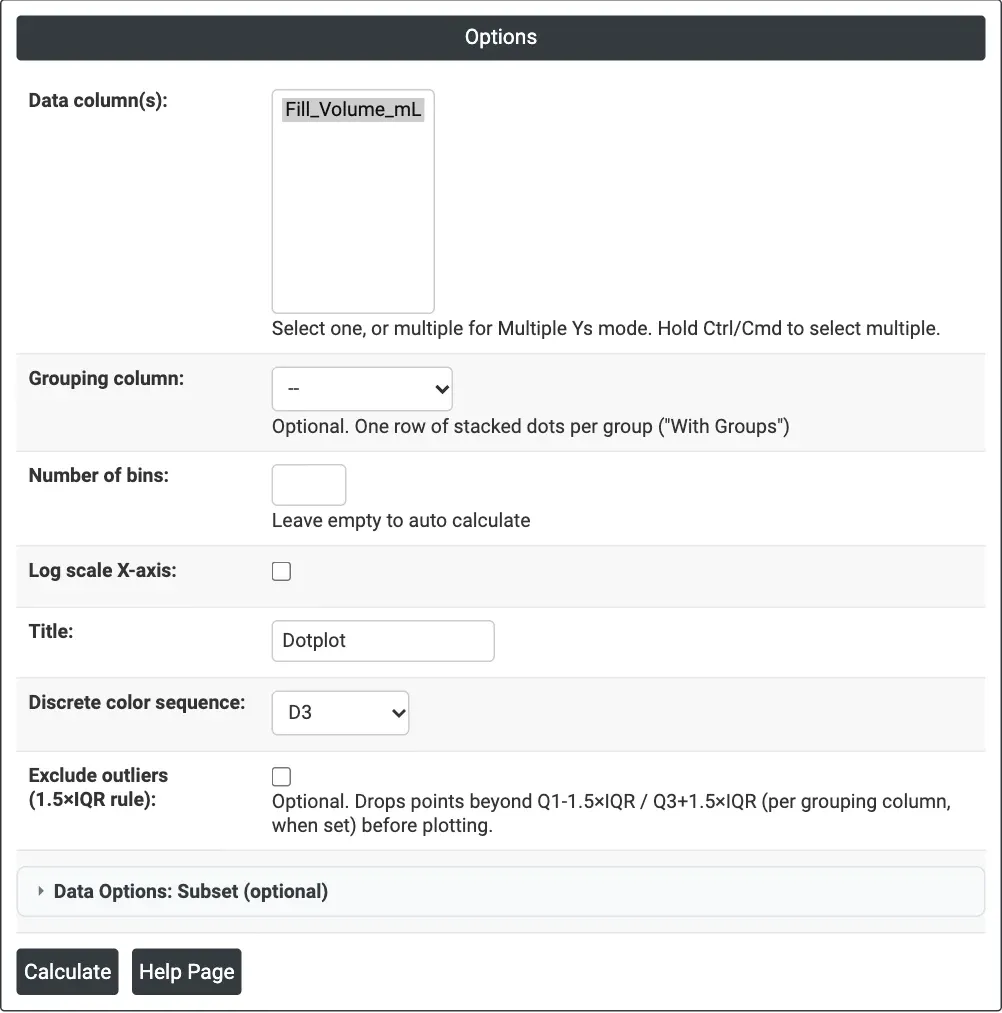
Figure 1 — Dotplot of the fill volume of 25 bottles, with the number of bins calculated automatically.
Output Descriptions
- Dotplot — stacked dots along the X axis, one dot per value; with groups or several columns, one row each, named on the vertical axis.
- Outlier note — when Exclude outliers removes points: how many were excluded.
- PDF export via Download.
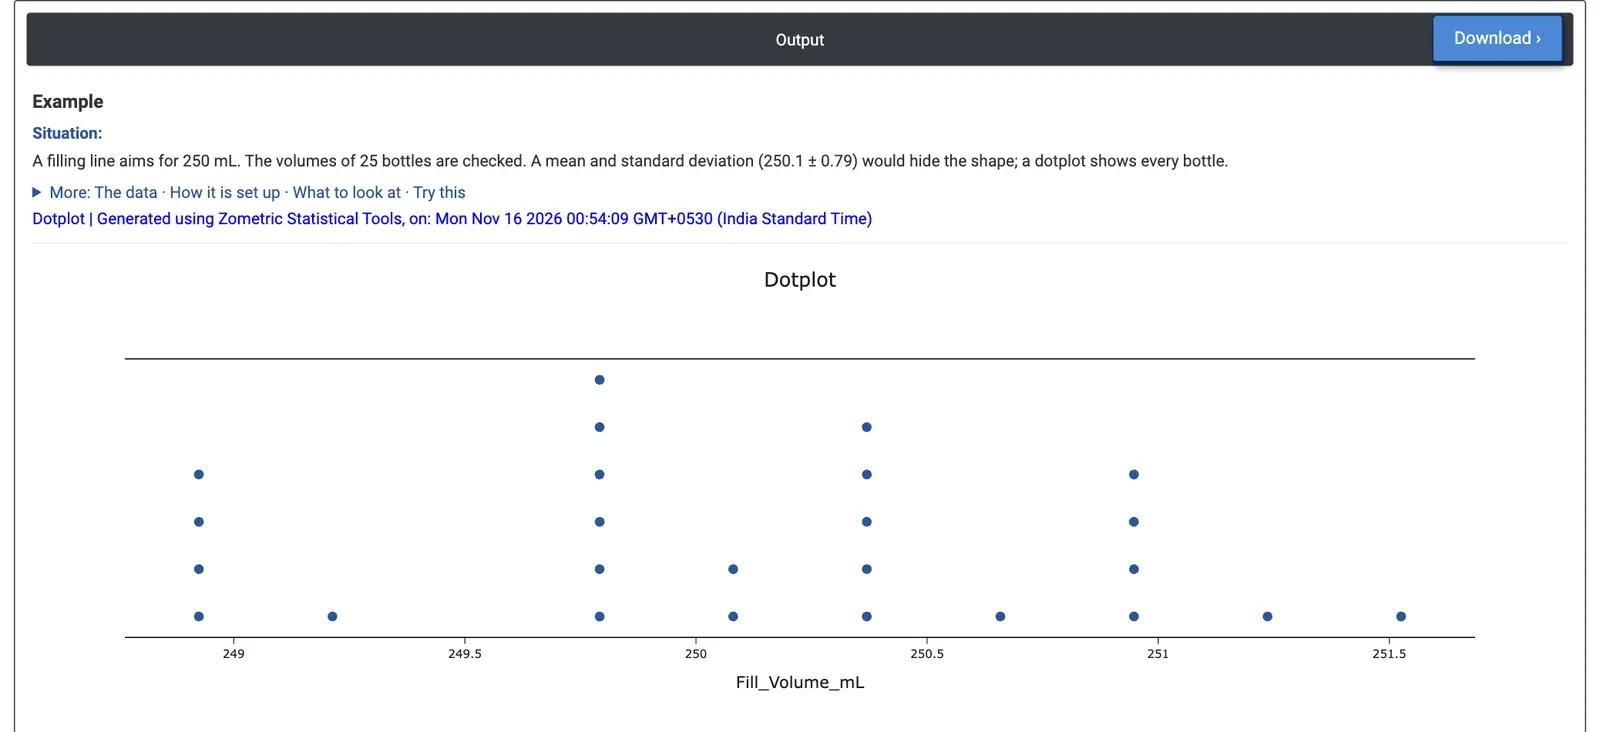
Figure 2 — Fill volumes of 25 bottles: heaps near 249.8, 250.4 and 251.0 mL and a separate group of four near 248.9 mL.
Worked Example
A filling line aims for 250 mL per bottle. The line supervisor checks the volume of 25 bottles. The mean is 250.10 mL with a standard deviation of 0.79 mL, which looks fine, but numbers like these hide the shape of the data. The supervisor selects Data column(s) = Fill_Volume_mL and leaves Number of bins empty, so the tool uses 10 bins about 0.29 mL wide.
The fills run from 248.78 to 251.67 mL. The dots do not form one tidy bell: there are heaps of six bottles near 249.8 mL, five near 250.4 mL and four near 251.0 mL, and a separate group of four low bottles near 248.9 mL (248.78 to 249.05 mL), set apart by a gap with no bottles between 249.21 and 249.68 mL. With Number of bins = 30 the stacks are at most three dots high, but the four low bottles still stand apart from the rest. Exclude outliers removes none of them, because they are within 1.5×IQR of the quartiles: they are a group, not stray points.
For the decision this means asking what splits the bottles, for example whether one filling nozzle runs low, before adjusting the line setting as a whole. If the nozzle number is recorded for each bottle, using it as the Grouping column shows directly whether the low bottles come from one nozzle.