
Double Exponential Smoothing
On this page
Purpose
Double Exponential Smoothing (Holt's method) smooths a time series with two running components, a level and a trend, so its forecasts keep rising or falling at the latest trend rate. Use it for a series with a steady upward or downward drift and no seasonal pattern, for example cumulative wear, demand that grows month by month, or a slowly drifting process mean. For data with a season, use Winters' Method or Decomposition.
Key Capabilities
- Level weight (alpha) and trend weight (gamma) that you specify, or optimal weights from an ARIMA(0,2,2) fit when both are left blank.
- Starting level and trend from the data or values you enter.
- Forecasts along the latest trend with prediction limits that widen with each period ahead, from the end of the series or from an earlier row.
- MAPE, MAD and MSD accuracy measures, and a plot of the data, fits and forecasts.
- Optional results table (level, trend, prediction and error for every period) and four-in-one residual plots.
Statistical Methods
At each period the level and trend are updated: Lₜ = α·yₜ + (1 − α)·(Lₜ₋₁ + Tₜ₋₁) and Tₜ = γ·(Lₜ − Lₜ₋₁) + (1 − γ)·Tₜ₋₁. The fit for period t is Lₜ₋₁ + Tₜ₋₁, and the forecast m periods after the origin is L + m·T, using the level and trend at the origin. A larger α lets the level follow recent values more closely; a larger γ lets the trend change faster.
With specified weights, the starting level and trend are the intercept and slope of a least-squares line of the data on time. When the weights are left blank, the tool fits an ARIMA(0,2,2) model to the second differences by least squares and converts its coefficients: α = 1 + θ₂ and γ = (2 − α − θ₁) / α; the starting level and trend are back-calculated from that fit. Optimal weights can fall outside 0 to 1 and should be checked for sense. With Starting values = User-specified, the Initial level and Initial trend you enter are used.
The prediction limits are forecast ± z × dₘ × MAD, where z is the normal quantile for the confidence level, MAD is the mean absolute error of the fits, and dₘ is a factor that grows with the number of periods ahead m (computed from the larger of α and γ), so the band widens further into the future. Accuracy: MAPE = mean |error / data| × 100, MAD = mean |error|, MSD = mean error². The series must have no gaps and at least 4 values.
Input Fields & Options
Field | Description |
Variable (Y) | Required. The numeric series, in time order. |
Level weight (alpha) / Trend weight (gamma) | 0.0001 to 1. Leave both empty to use the optimal ARIMA(0,2,2) weights. |
Starting values | From the data (default): back-calculated from the ARIMA fit (optimal weights) or from the regression of the data on time (specified weights). Or User-specified. |
Initial level / Initial trend | Used when Starting values is User-specified; both are then required. |
Number of forecasts | Default 0 (none), up to 1000. |
Confidence level (%) for forecast interval | Default 95. Active when forecasts are requested. |
Forecast origin (row) | Optional, active when forecasts are requested. Forecasts start after this row, using the data up to it; blank = end of the series. |
Results to display | Summary table (default) or Summary table and results table. |
Residual plots (four in one) | Unticked by default. Normal probability plot, residuals versus fits, histogram and residuals versus order. |
Title | Title of the output. Default Double Exponential Smoothing. |
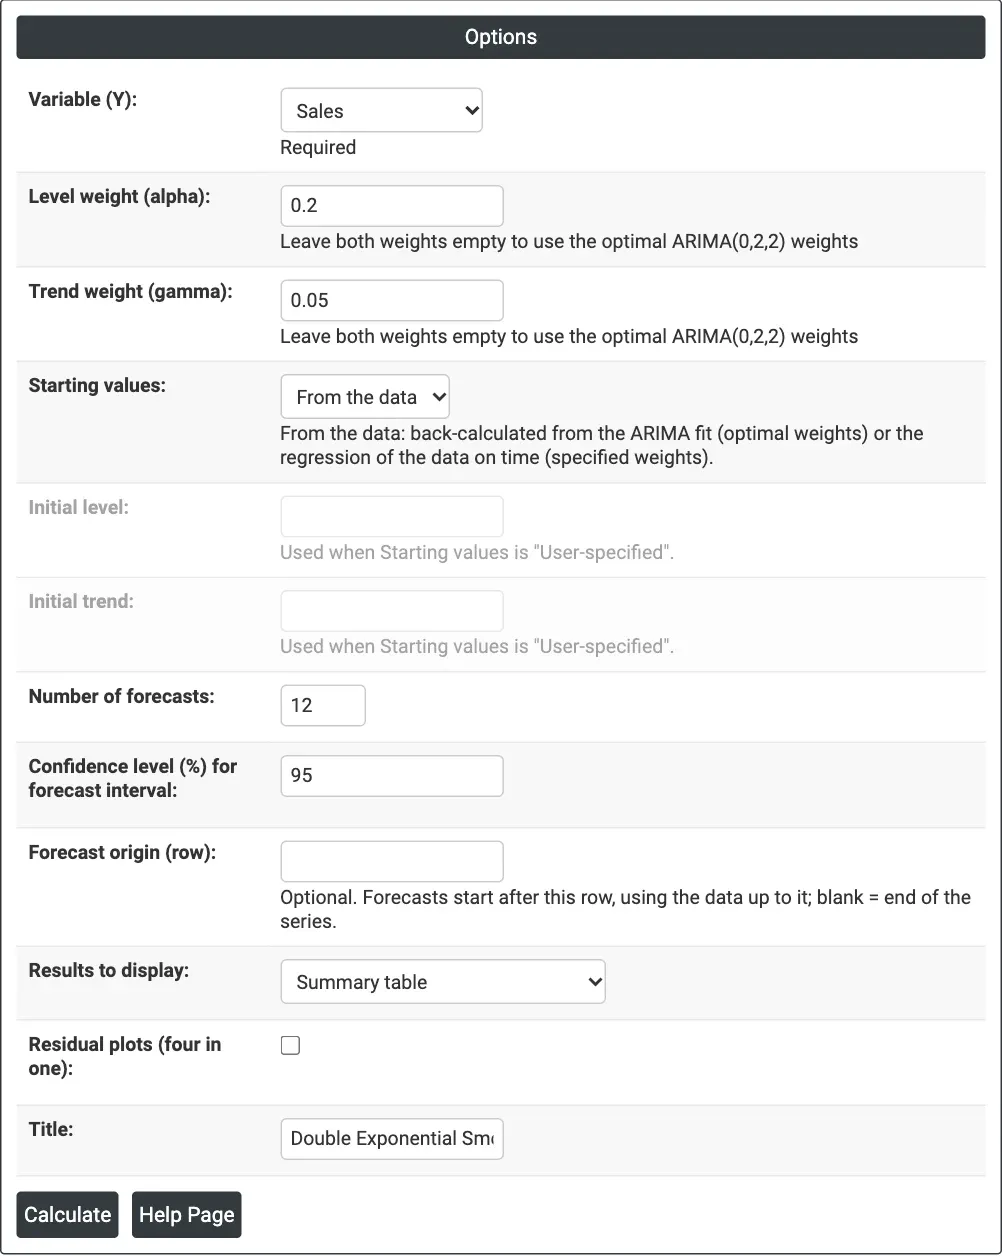
Figure 1 — Monthly Sales with alpha = 0.2, gamma = 0.05 and 12 forecasts.
Output Descriptions
- Double Exponential Smoothing (graph) — actual data, fits, forecasts and the prediction band, with MAPE, MAD and MSD in the title and the weights used above the plot.
- Method — data column, length and whether the weights were specified or optimal (plus the forecast origin when set).
- Smoothing Constants — α (level) and γ (trend).
- Accuracy Measures — MAPE, MAD and MSD.
- Forecasts — period, forecast, lower and upper limits.
- Results — when chosen: Period, data, Level, Trend, Predict and Error for each period.
- Residual Plots — when ticked.
- PDF export via Download.
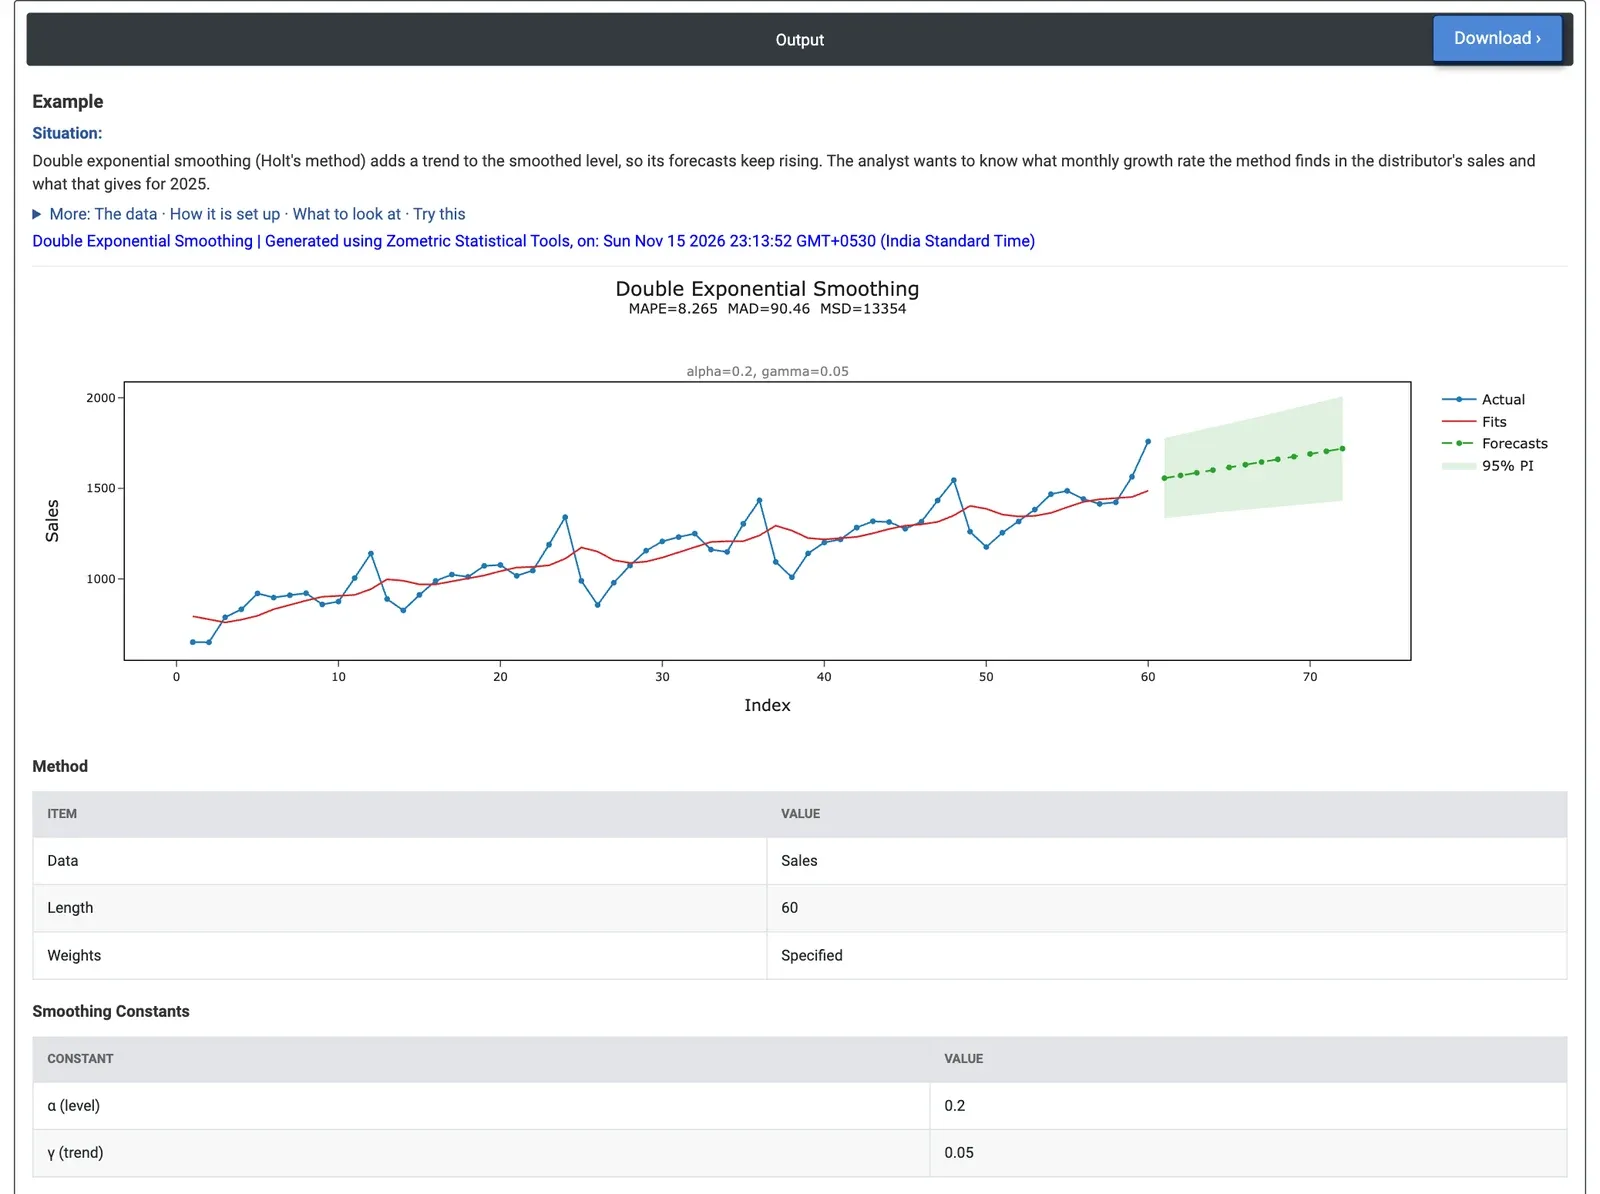
Figure 2 — Holt's method on monthly sales: the forecasts for 2025 rise in a straight line inside a widening 95% band.
Worked Example
A consumer electronics distributor has 60 months of unit sales (January 2020 to December 2024) that grow every year. The sales analyst wants to know what monthly growth Holt's method finds and what it gives for 2025. The analyst selects Variable (Y) = Sales, enters Level weight (alpha) = 0.2 and Trend weight (gamma) = 0.05 (a level that follows the data gently and a trend that changes slowly, so the season does not throw the trend around) and sets Number of forecasts = 12.
At the end of 2024 the trend is 14.85 units a month, so the forecasts rise in a straight line from 1,556 in January 2025 to 1,719 in December 2025. The 95% interval widens with each month ahead: 1,334 to 1,778 for January and 1,431 to 2,008 for December. MAPE is 8.3% (MAD 90.5), better than single smoothing (9.4%) but well behind Winters' Method (4.2%) and Decomposition (2.2%), because the method has no season. The January forecast of 1,556 is probably too high: every year sales drop sharply from December to January (1,759 in December 2024, but 1,261 in January 2024).
With both weights left blank, the optimal ARIMA weights are alpha 1.42 and gamma 0.0001. The fit barely changes (MAPE 8.3%), but the forecasts climb to 3,301 in December 2025, because the level overreacts to the December 2024 peak. Optimal weights need a sense check; here the seasonal swings throw them off. For the decision: use Holt's method for a trend without a season, and Winters' Method for this data.