
Factor Analysis
On this page
Purpose
Factor Analysis explains the correlations among many measured variables with a few underlying factors. Variables that move together load on the same factor, so a long list of measurements or survey items can be summarised by a handful of factors that are easier to name and track. Use it to find the few underlying characteristics behind a set of test results, process measurements or questionnaire items, and to see which variables are largely their own story.
Key Capabilities
- Extracts the number of factors you choose from three or more numeric variables.
- Two extraction methods: Principal Components and Maximum Likelihood.
- Varimax rotation to make each factor load strongly on fewer variables, so it is easier to name.
- Factor Loadings table with each variable's communality and uniqueness.
- Percentage of variance explained by each factor, and a loading plot of the first two factors.
Statistical Methods
Rows with a missing or non-numeric value in any selected variable are dropped, and each variable is standardised to mean 0 and standard deviation 1, so the analysis works on the correlation matrix. The number of factors must be less than the number of variables, and there must be more rows than variables.
With Principal Components extraction, the correlation matrix is split into eigenvalues and eigenvectors; the loadings of factor j are the j-th eigenvector multiplied by the square root of its eigenvalue, for the largest eigenvalues. With Maximum Likelihood extraction, the common factor model (each standardised variable = loadings × factors + a unique error) is fitted by maximum likelihood with an iterative algorithm, stopping after Maximum iterations (default 1000) or when the change falls below the Convergence tolerance (default 0.01). Maximum likelihood assumes the variables are roughly multivariate normal.
Varimax rotation (Kaiser's method) turns the factors so that the variance of the squared loadings within each factor is as large as possible: each variable then loads high on one factor and near zero on the others. Rotation does not change how much each variable is explained. After rotation the factors are put in order of the variance they explain. A variable's communality is the sum of its squared loadings, the share of its variance explained by the factors; uniqueness is 1 − communality. The variance explained by a factor is the sum of its squared loadings, reported as a percentage of the number of variables. The sign of a factor is arbitrary: a factor with all signs reversed means the same thing.
Input Fields & Options
Field | Description |
Variables | Three or more numeric columns. Ctrl or Command + click to select several. |
Number of factors to extract | Default 2. Must be less than the number of variables. |
Method of extraction | Principal Components (default) or Maximum Likelihood. |
Type of rotation | Varimax (default) or None. Rotation applies only with 2 or more factors. |
Maximum iterations | Optional, only used by Maximum Likelihood extraction. Leave blank for the default (1000). |
Convergence tolerance | Optional, only used by Maximum Likelihood extraction. Leave blank for the default (0.01). |
Title | Title shown on the loading plot. Default Factor Analysis. |
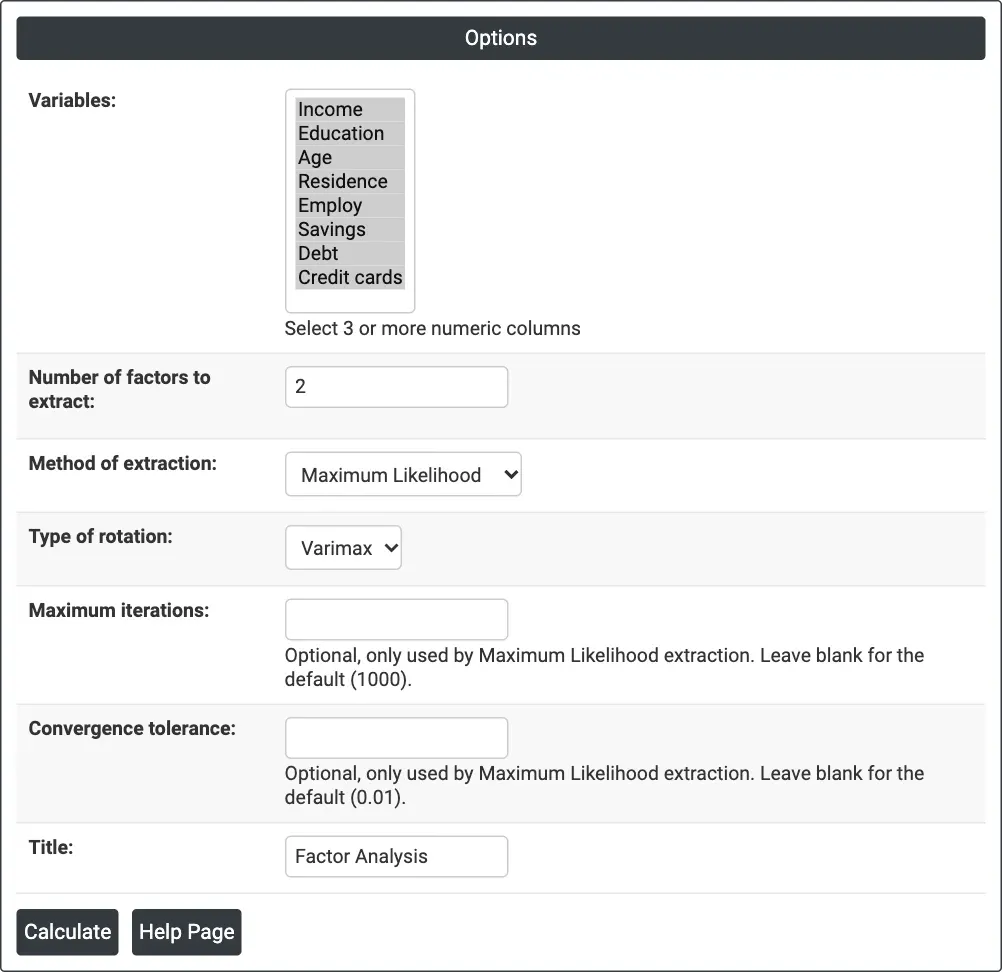
Figure 1 — Options for the example: eight loan-applicant variables, 2 factors, Maximum Likelihood extraction, Varimax rotation.
Output Descriptions
- Factor Loading Plot — each variable drawn as a line from the origin to its loadings on Factor1 (x) and Factor2 (y). Variables pointing the same way load on the same factor.
- Method, rotation and variance explained — the method and rotation by name (for example Maximum Likelihood, Varimax), the percentage of total variance explained by each factor and the cumulative percentage.
- Factor Loadings — for each variable, its loading on each factor, its Communality and its Uniqueness.
- PDF export via Download.
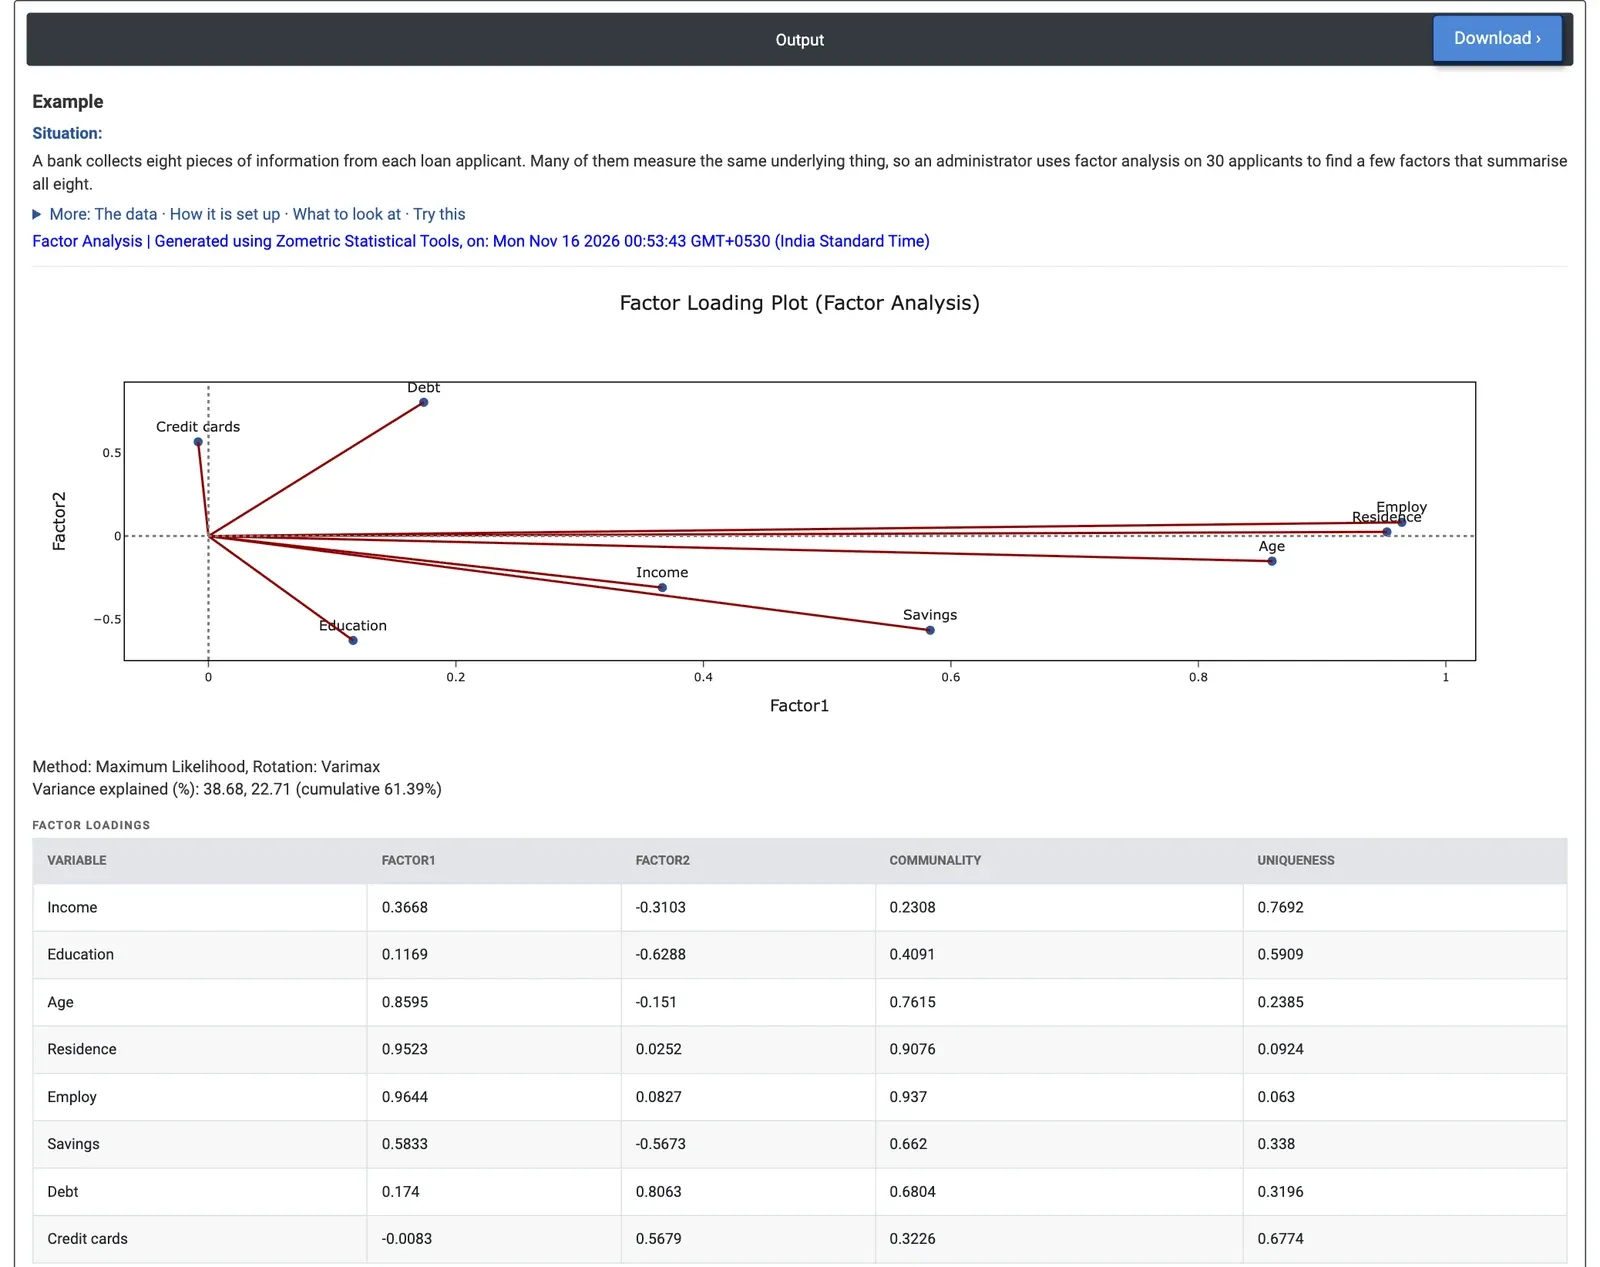
Figure 2 — Two rotated factors for eight loan-applicant variables: a stability factor (Employ, Residence, Age) and a borrowing factor (Debt, Credit cards against Education), explaining 61.39% of the variance.
Worked Example
A bank collects eight pieces of information from each loan applicant: income, years of education, age, years at the current address (Residence), years with the current employer (Employ), savings, debt and number of credit cards. Many of them seem to measure the same thing. A credit administrator wants a few factors that summarise all eight. Using 30 applicants, the engineer selects all eight columns, sets Number of factors to extract = 2, Method of extraction = Maximum Likelihood and Type of rotation = Varimax.
The two factors explain 38.68% and 22.71% of the variance, 61.39% together. Factor 1 loads heavily on Employ (0.9644), Residence (0.9523) and Age (0.8595) and moderately on Savings (0.5833): a stability and experience factor. Factor 2 loads on Debt (0.8063) and Credit cards (0.5679), against Education (−0.6288) and Savings (−0.5673): a borrowing factor. The communalities show how well the two factors describe each variable: high for Employ (0.937) and Residence (0.9076), low for Income (0.2308) and Credit cards (0.3226).
For the bank, two factors describe applicants' stability and borrowing well, but income is largely its own story. With 3 factors the variance explained rises to 72.93% (36.67%, 20.63% and 15.63%), and the third factor is mainly Income (−0.8835) with Education (−0.5491); Income's communality rises to 0.8545. This matches Cluster Variables on the same data, which groups Income with Education, the stability variables together, and Debt with Credit cards. Without rotation the loadings change only a little here (Factor 1: Employ 0.9666, Residence 0.9526), because the unrotated solution is already fairly simple.