
Financial Data
On this page
Purpose
Financial Data records the money side of an improvement project: the annualized hard savings, soft savings and implementation costs, each as an estimate and as an actual, together with the date the savings start and the status of the finance review. It spreads the annual figures over the first 12 months from the start date and shows gross and net savings by month and in total. Use it in a Lean Six Sigma or Kaizen project file so that the project leader, the champion and the financial analyst look at the same numbers, and to compare the estimate made at the start of the project with what was achieved.
Key Capabilities
- Estimated and actual figures side by side for hard savings, soft savings and implementation costs.
- Financial Review Status to record where the numbers stand: Unreviewed, Estimates Approved, Actuals Approved, Audit Required or Needs Further Review.
- Monthly schedule for the 12 months from the savings start date, with gross and net savings.
- Project totals for every column.
- Works without worksheet data: all inputs are typed into the form.
Statistical Methods
No statistics are estimated; the tool applies fixed rules. Each annualized amount is spread evenly over the 12 months from the savings start date: the monthly value is the annual value / 12. Gross Savings = Hard Savings + Soft Savings, and Net Savings = Gross Savings − Implementation Costs, calculated separately for the estimated and the actual columns. If one of hard or soft savings is blank, gross savings use the other one; if implementation costs are blank they count as zero; if both savings are blank, gross and net savings show *. A blank field is shown as *, and without a full start date (month and year) the Date column shows *. Project totals add the 12 months, so they equal the annual figures.
Standard practice in improvement projects: hard savings are those that show up in the profit and loss account (less scrap, lower material or energy cost, less overtime); soft savings are real but harder to trace to the accounts (cost avoidance, freed capacity, time saved). Implementation costs are what the project spends to make the change (equipment, tooling, training, contractor time). Many companies count only hard savings, net of costs, for project targets, and ask a financial analyst to approve the estimate at the start and the actuals after the change has run for some months.
Input Fields & Options
Field | Description |
Project Name | Optional. Shown at the top of the output. |
Financial Review Status | Unreviewed (default), Estimates Approved, Actuals Approved, Audit Required or Needs Further Review. |
Savings Start Date: month / Savings Start Date: year | The first month in which savings are counted. The year list runs from three years before the current year to seven years after it. |
Annualized Hard Savings: Estimated / Actual | Hard savings per year, in your currency. Optional. |
Annualized Soft Savings: Estimated / Actual | Soft savings per year. Optional. |
Annualized Implementation Costs: Estimated / Actual | Costs of making the change, as a yearly figure. Optional; blank counts as zero. |
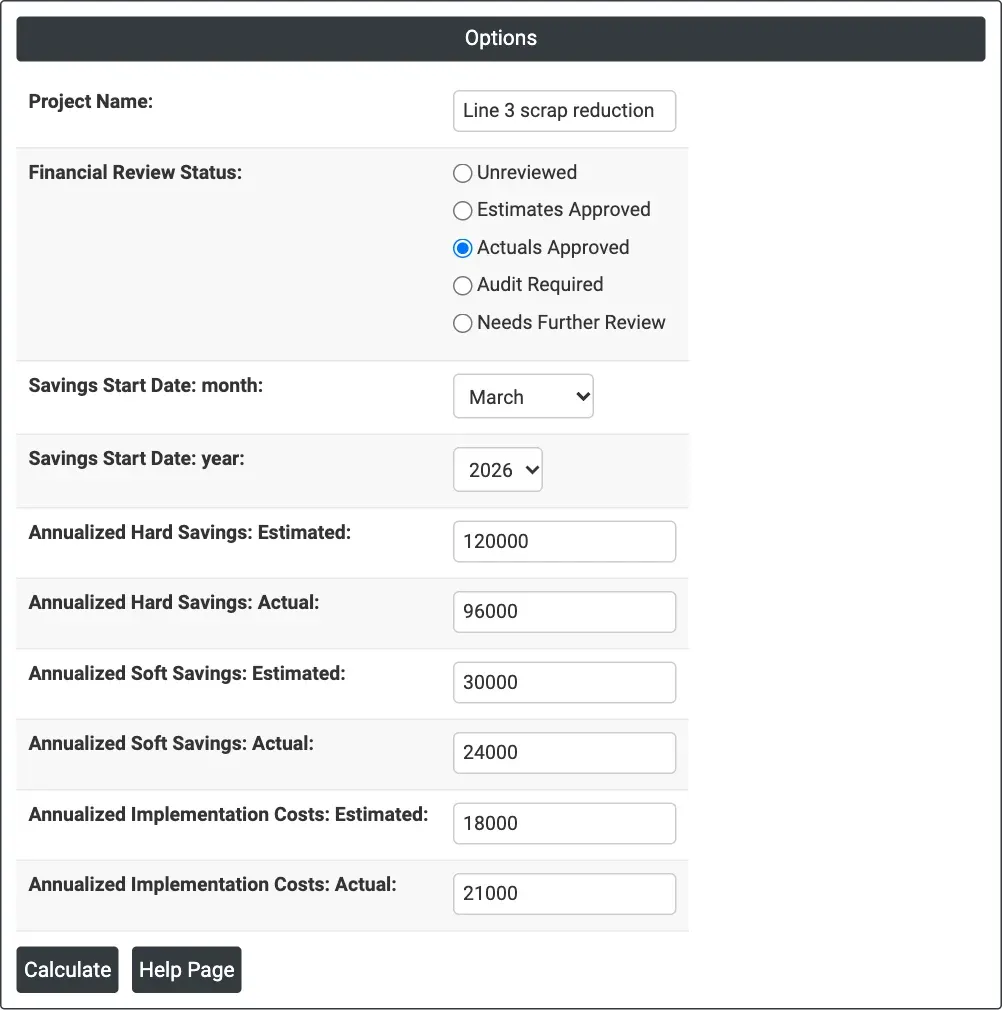
Figure 1 — The financial data of a scrap reduction project starting in March 2026, with estimated and actual savings and costs.
Output Descriptions
- Financial Data — Project Name, Financial Review Status and Savings Start Date.
- Annualized Financial Savings — the six annual figures as entered: hard savings, soft savings and implementation costs, each estimated and actual.
- Monthly Financial Savings — for each of the 12 months (# and Date): hard, soft and gross savings, implementation costs and net savings, estimated and actual, with Project Totals in the last row.
- PDF export via Download.
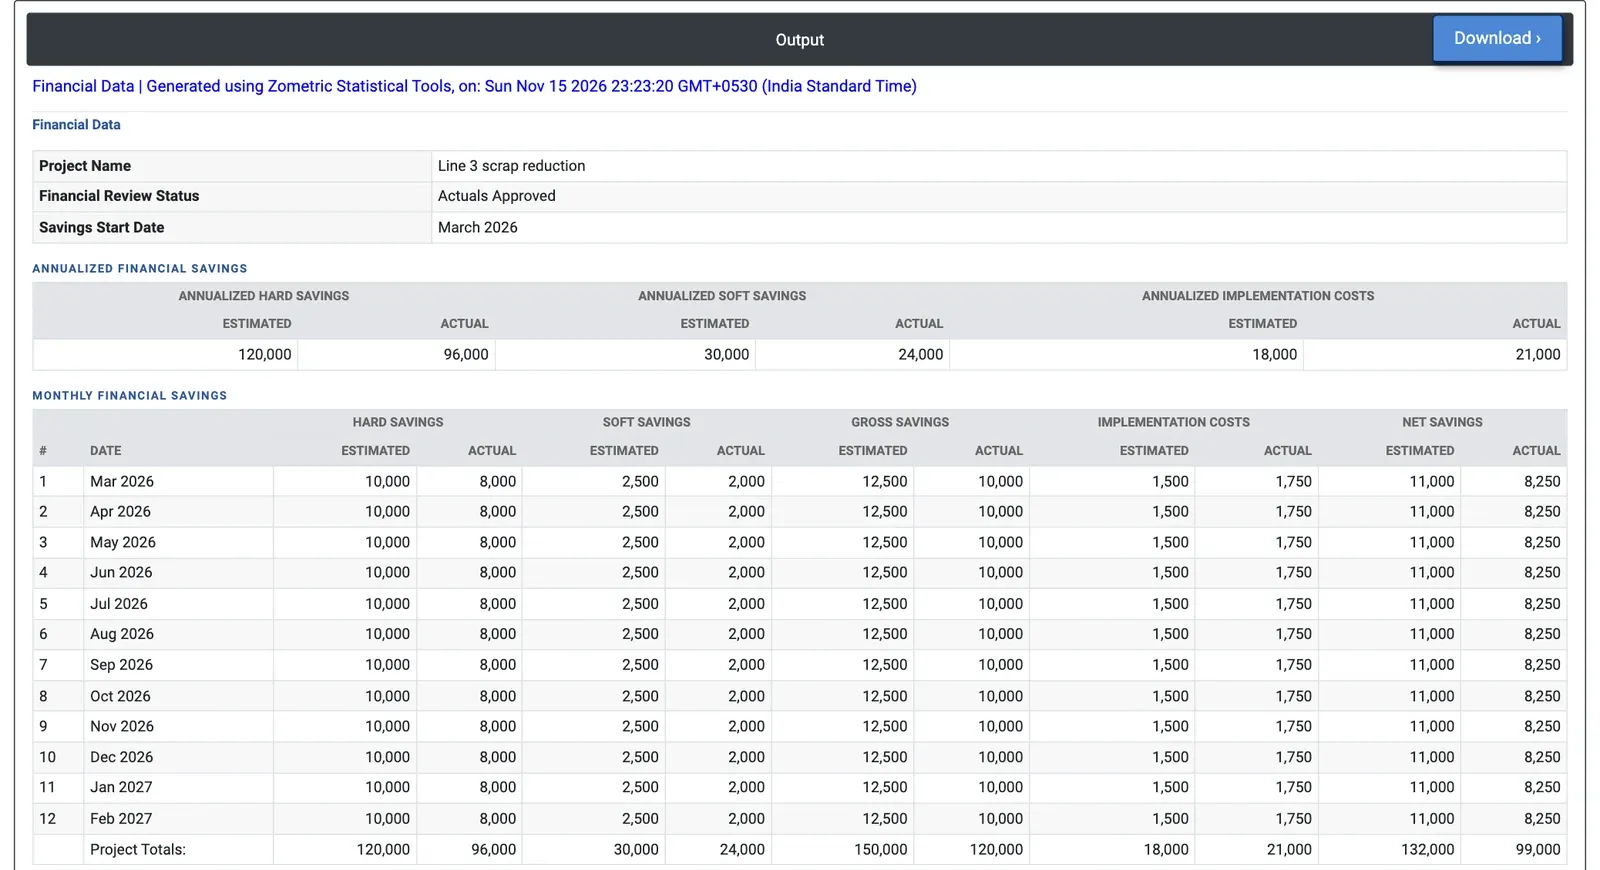
Figure 2 — Monthly savings from March 2026 to February 2027: net savings of 132,000 estimated against 99,000 actual.
Worked Example
A Green Belt has led a project to reduce scrap on Line 3. At the start, the plant controller estimated hard savings (scrap material and rework labour) of 120,000 a year, soft savings (freed inspection time) of 30,000 a year, and implementation costs of 18,000 a year. After the change had run for some months, the actual figures were 96,000 hard savings, 24,000 soft savings and 21,000 costs. The savings started in March 2026, and the controller has approved the actuals. The Green Belt enters these values, chooses Savings Start Date = March 2026 and Financial Review Status = Actuals Approved, and clicks Calculate.
The monthly table runs from March 2026 to February 2027. Each month shows estimated hard savings of 10,000 against 8,000 actual, and gross savings of 12,500 against 10,000. Costs are 1,500 estimated and 1,750 actual per month, so net savings are 11,000 estimated and 8,250 actual per month. The project totals are 150,000 gross and 132,000 net estimated, against 120,000 gross and 99,000 net actual.
For the project review this means the project delivered 75% of the net savings it promised (99,000 of 132,000): savings came in at 80% of the estimate, and costs were 3,000 higher. Counting hard savings only, the net figure is 96,000 − 21,000 = 75,000 against 102,000 estimated. The gap is a point for the champion to discuss at the project close, for example whether the scrap rate has reached its target yet.