
Gage R&R Study (Expanded)
On this page
Purpose
Gage R&R Study (Expanded) measures how much of the variation in your results comes from the measurement system, when more than parts and operators may play a part: a second gauge, a fixture, a lab or a shift. Use it instead of a crossed Gage R&R when you have a third (or further) factor,, and you want to know whether the measurement system can tell the parts apart.
Key Capabilities
- Part and Operator plus up to 8 additional crossed random factors (e.g. gauge, fixture, lab).
- Data entered one row per measurement.
- ANOVA with automatic removal of non-significant interactions.
- Variance components, %Contribution, study variation, %StudyVar and, with spec limits, %Tolerance.
- Number of distinct categories (NDC).
- Process variation from the study parts or from a historical standard deviation; probabilities of misclassification against spec limits.
- Components of variation chart, measurement by part and by operator, part × operator interaction plot, and R and Xbar charts by operator.
Statistical Methods
All factors are treated as random and crossed. The tool fits a general linear model with all factors and their interactions, using adjusted sums of squares, then removes interaction terms whose p-value is above 0.05, the highest-order interactions first, and refits. Variance components are found from the expected mean squares of the final model; a negative estimate is set to 0. Rows with a missing measurement or factor value are dropped.
Part is the part-to-part term. Repeatability is the error variance; reproducibility is the sum of the components of every other factor and remaining interaction; Total Gage R&R = repeatability + reproducibility, and total variation = Gage R&R + part-to-part. %Contribution is each variance as a share of the total variance. Study variation = k × standard deviation (k = 6 by default); %StudyVar = study variation / total study variation; %Tolerance = study variation / (USL − LSL), or with one limit, half the study variation over the distance from the mean to that limit. NDC = floor(√2 × σ(part) / σ(Gage R&R)).
With a historical standard deviation that is larger than the Gage R&R standard deviation, it is used as the total, and part-to-part variation is what remains; %Process is then also shown. A common rule of thumb (AIAG): %StudyVar below 10% is acceptable, 10 to 30% may be acceptable depending on the application, and above 30% is not; NDC should be at least 5.
Input Fields & Options
Field | Description |
Part | Column identifying the part (or sample). Required. |
Operator | Column identifying the operator (or analyst). Required. |
Additional factor (optional) | Third crossed random factor, e.g. Gage/Fixture/Lab. Leave blank for a standard 2-factor Part × Operator study. |
More additional factors (optional) | Further crossed random factors; up to 8 additional factors in total. |
Measurement | Numeric column of results. Required. |
Study variation multiplier (k) | Number of standard deviations spanned by study variation; default 6. |
Estimate process variation | Use the parts in this study (default) or Use a historical standard deviation. |
Historical standard deviation | Shown and required for the historical option. |
Lower spec limit (optional) / Upper spec limit (optional) | Add %Tolerance to the table. |
Display probabilities of misclassification | Enabled when at least one spec limit is given. |
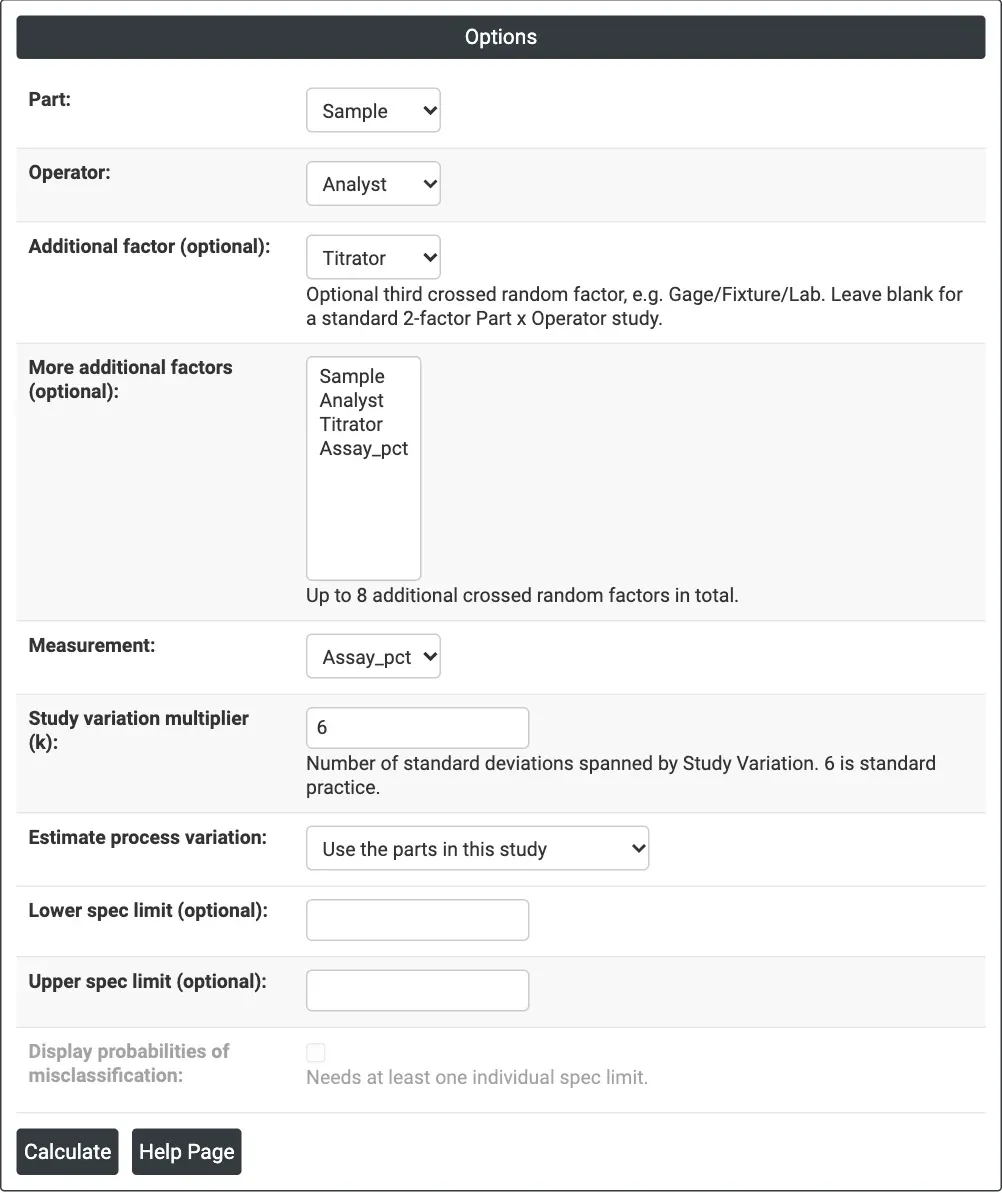
Figure 1 — Options for the titrator study: Sample as Part, Analyst as Operator, Titrator as the additional factor, Assay_pct as the measurement, k = 6.
Output Descriptions
- Summary — %Gage R&R (StudyVar), Number of Distinct Categories, the factors, the terms removed and N.
- ANOVA Table — DF, Adj SS, Adj MS, F and P for the final model.
- Gage R&R — VarComp, %Contribution, StdDev, StudyVar and %StudyVar (and %Tolerance, %Process) for Total Gage R&R, Repeatability, Reproducibility and its factors, Part-To-Part and Total Variation.
- Probabilities of misclassification — when selected.
- Components of Variation, measurement by part, measurement by operator, Part × Operator Interaction, R Chart by operator and Xbar Chart by operator.
- PDF export via Download.
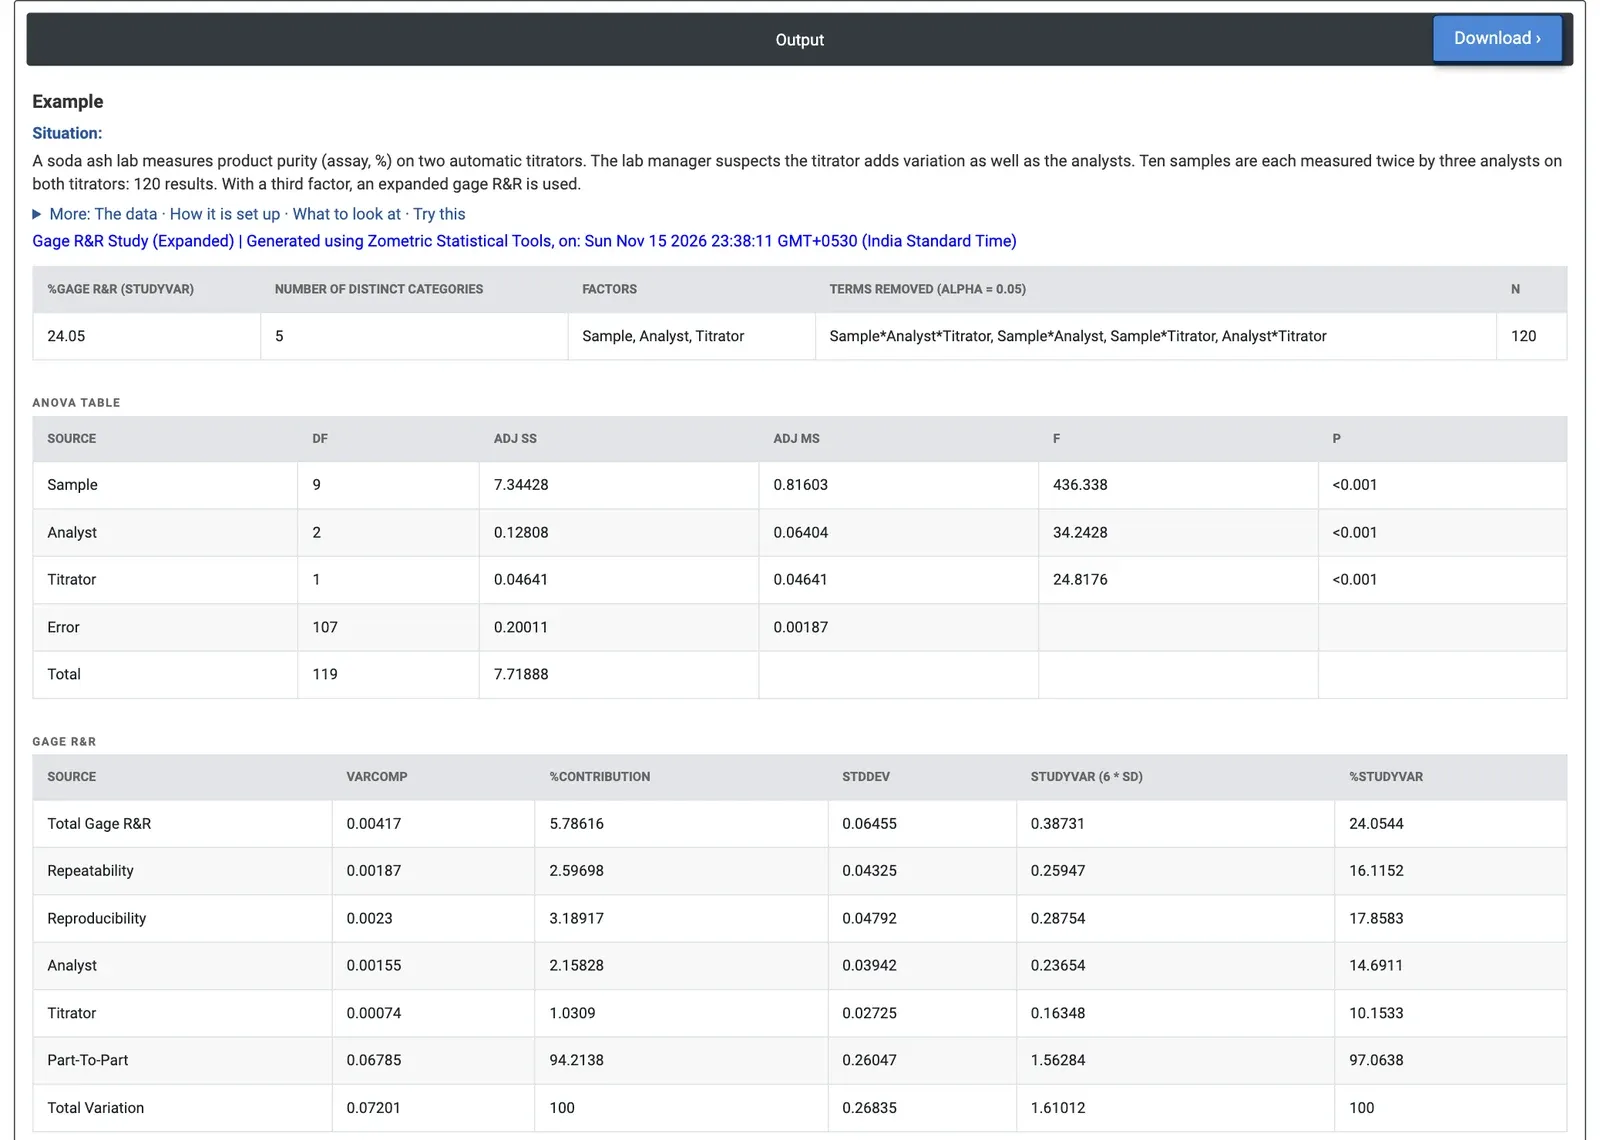
Figure 2 — Expanded Gage R&R for the assay: Total Gage R&R is 24.05% of the study variation with 5 distinct categories; all interactions were removed.
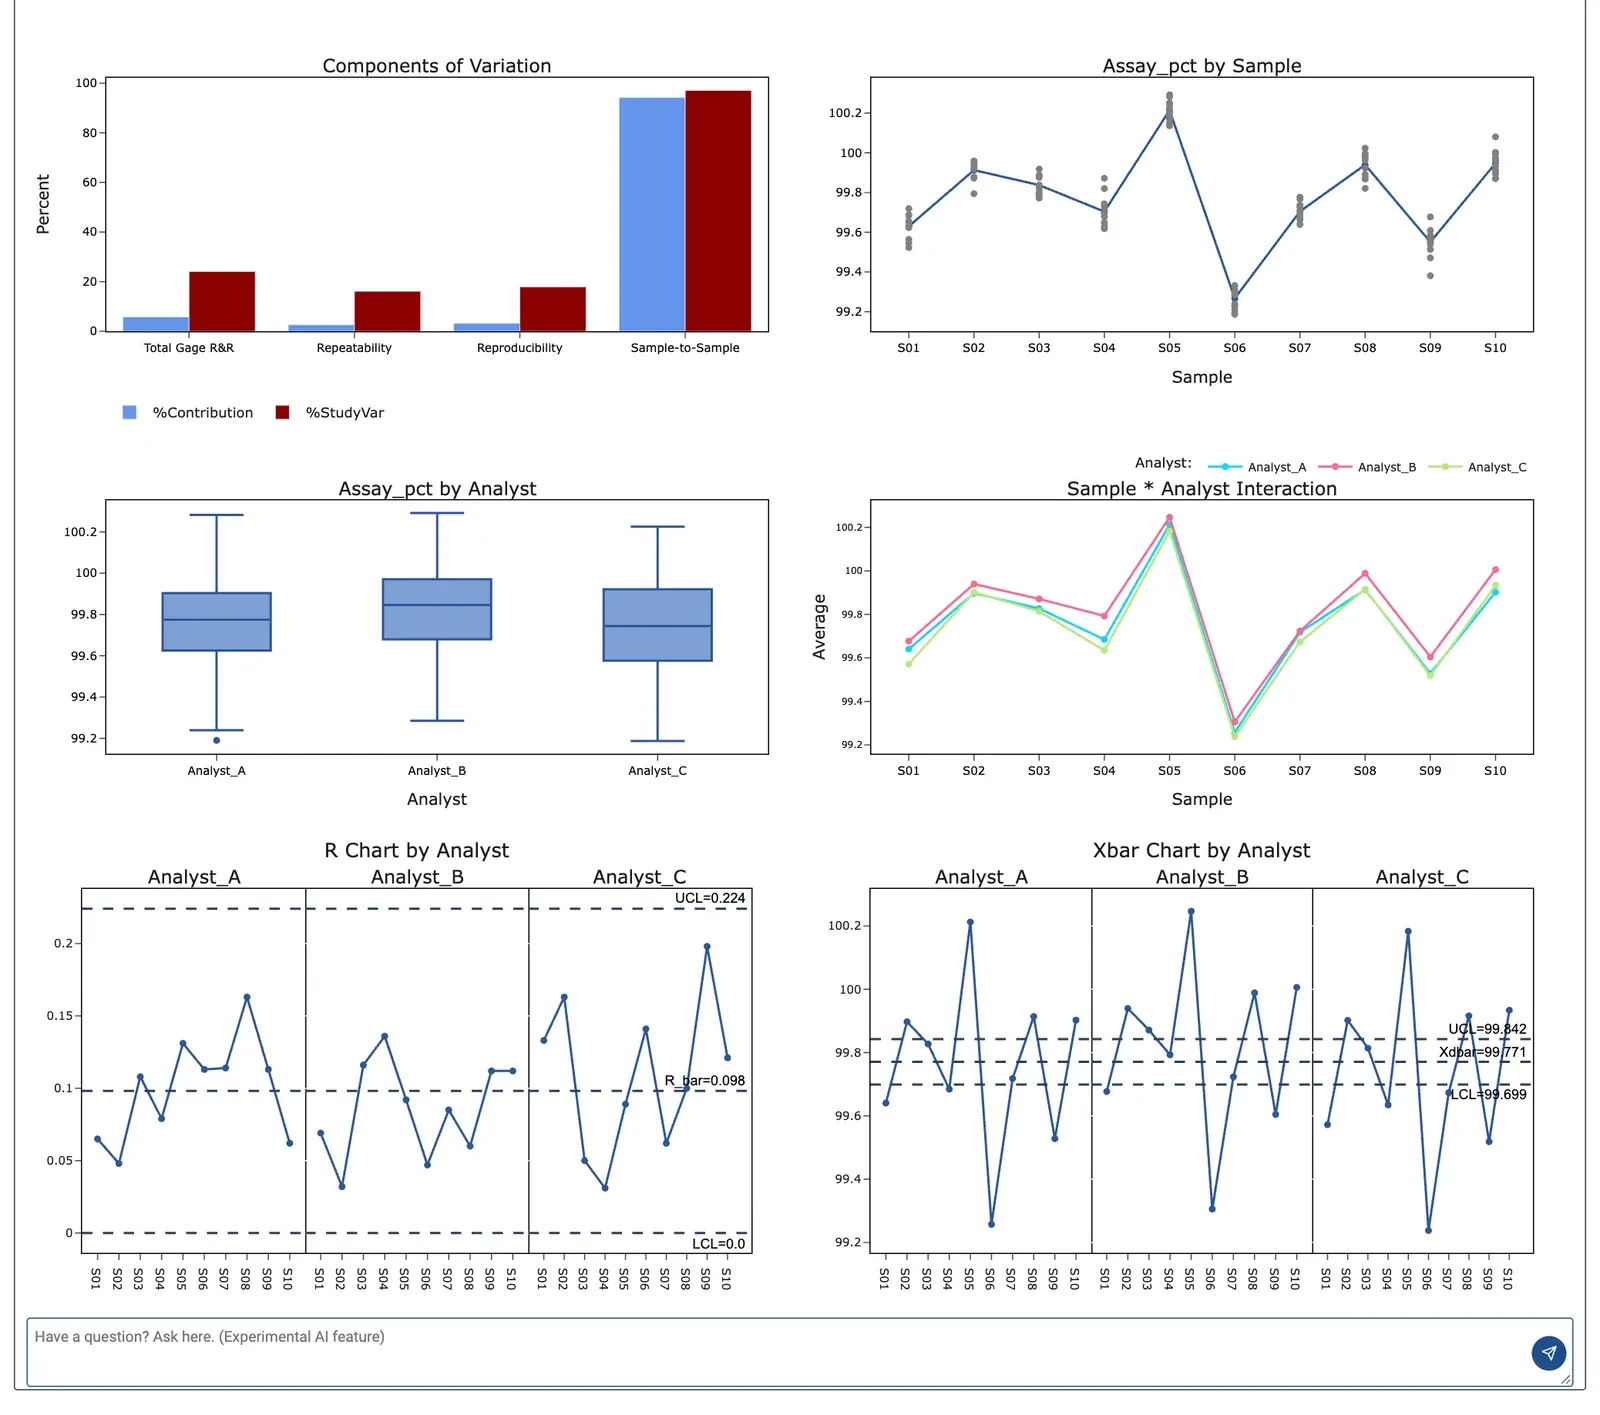
Figure 3 — Graphs for the titrator study: the samples dominate the components of variation, the analysts' lines run parallel, and most Xbar points lie outside the limits.
Worked Example
A soda ash lab measures product purity (assay, %) on two automatic titrators, T1 and T2, and the lab manager suspects the titrator adds variation as well as the analysts. Ten samples are each measured twice by three analysts on both titrators: 120 results. The manager selects Sample as Part, Analyst as Operator, Titrator as the additional factor and Assay_pct as the measurement.
None of the interactions is significant, so all four (Sample*Analyst*Titrator, Sample*Analyst, Sample*Titrator, Analyst*Titrator) are removed. In the final model the samples differ strongly (F = 436.3) and both Analyst (F = 34.24) and Titrator (F = 24.82) are significant, all with p < 0.001.
Total Gage R&R is 24.05% of the study variation (5.79% of the variance): repeatability 16.12%, analysts 14.69% and titrators 10.15%. The number of distinct categories is 5. By the usual rule this is a conditionally acceptable measurement system: it can tell five groups of samples apart, but the analysts and the titrators together contribute more than the repeat readings. The titrator does add variation, as suspected, though less than the analysts; aligning the analysts' method and calibrating the two titrators against a reference would bring the Gage R&R down.