
Gage Run Chart
On this page
Purpose
The Gage Run Chart is a quick picture of the raw data from a measurement system study, before the numbers of a full gage R&R. It plots every measurement by part and operator around a reference line, so you can see at a glance whether the parts differ much more than the repeat readings, whether one operator's repeats scatter more than the others (repeatability), and whether one operator reads consistently high or low (reproducibility). Use it with the Crossed Gage R&R study, or on its own to check the data for mistakes.
Key Capabilities
- One panel per part, five panels to a row, in part order.
- Inside each panel, each operator's readings side by side in trial order, joined by a line, with a separate colour and marker per operator.
- Reference line at the mean of all observations or at a historical mean.
- Trial order from a trial column, or from the row order of the data.
- Optional title and gage information (gage name, date, reported by, tolerance, notes) shown under the title.
- Accepts any number of operators and trials, with text or numeric part and operator labels.
Statistical Methods
The chart does no modelling: it arranges the raw readings so the eye can separate the sources of variation. Rows with a missing part, operator or response are dropped, and every response value must be numeric. For each part and operator the readings are taken in the order of the Trial numbers column when it is given and fully numeric, otherwise in row order. The reference line is the mean of all observations, labelled Mean, or the Historical mean entered, labelled Hist Mean.
How to read it: the spread of the readings within one operator's group in a panel is repeatability (equipment variation); a consistent difference between operators across the panels is reproducibility (appraiser variation); and the difference between the panels is part-to-part variation. A good measurement system shows small within-group scatter, operator groups at the same height, and clear differences between parts. An operator whose readings rise or fall over the trials in many panels may point to drift or learning. The chart gives no percentages; run the Crossed Gage R&R study for %Contribution, %Study Variation and the number of distinct categories.
Input Fields & Options
Field | Description |
Part | Required. Column with the part (sample) identifier; one panel per part. |
Operator | Required. Column with the operator (appraiser) identifier. |
Response | Required. Numeric column with the measurements. |
Trial numbers (optional) | Column giving the trial (replicate) number; orders each operator's readings of a part. Blank uses row order. |
Historical mean (optional) | Reference line at this value instead of the mean of all observations. |
Title | Optional. Default: Gage Run Chart of <response> by <part>, <operator>. |
Gage name / Date of study / Reported by / Tolerance / Misc | Optional text shown in a line under the title. Tolerance here is only a label; it does not change the chart. |
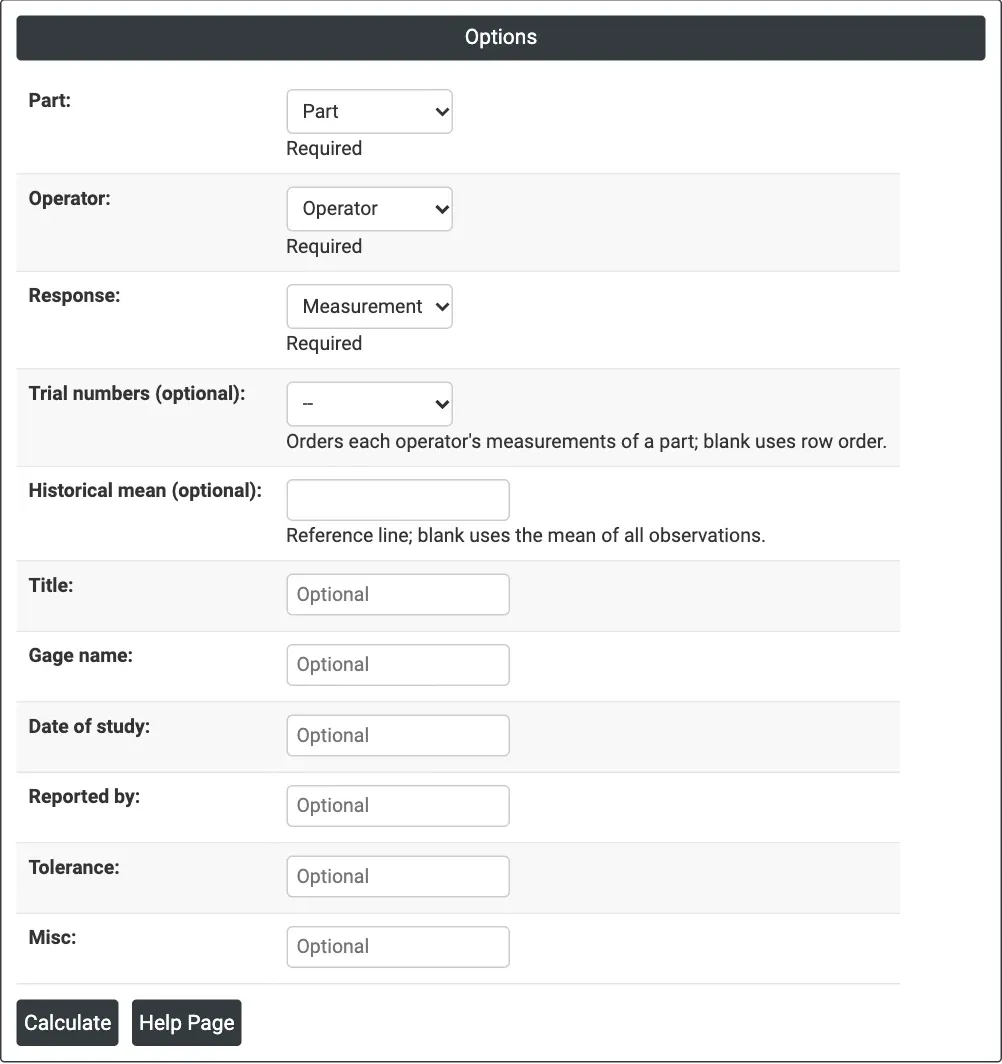
Figure 1 — Options for the example: Part, Operator and Measurement, with no trial column and the overall mean as the reference.
Output Descriptions
- Gage Run Chart of <response> by <part>, <operator> — one panel per part (panel title = part), each operator's readings in trial order with a legend for the operators, and the dashed reference line marked Mean or Hist Mean.
- PDF export via Download.
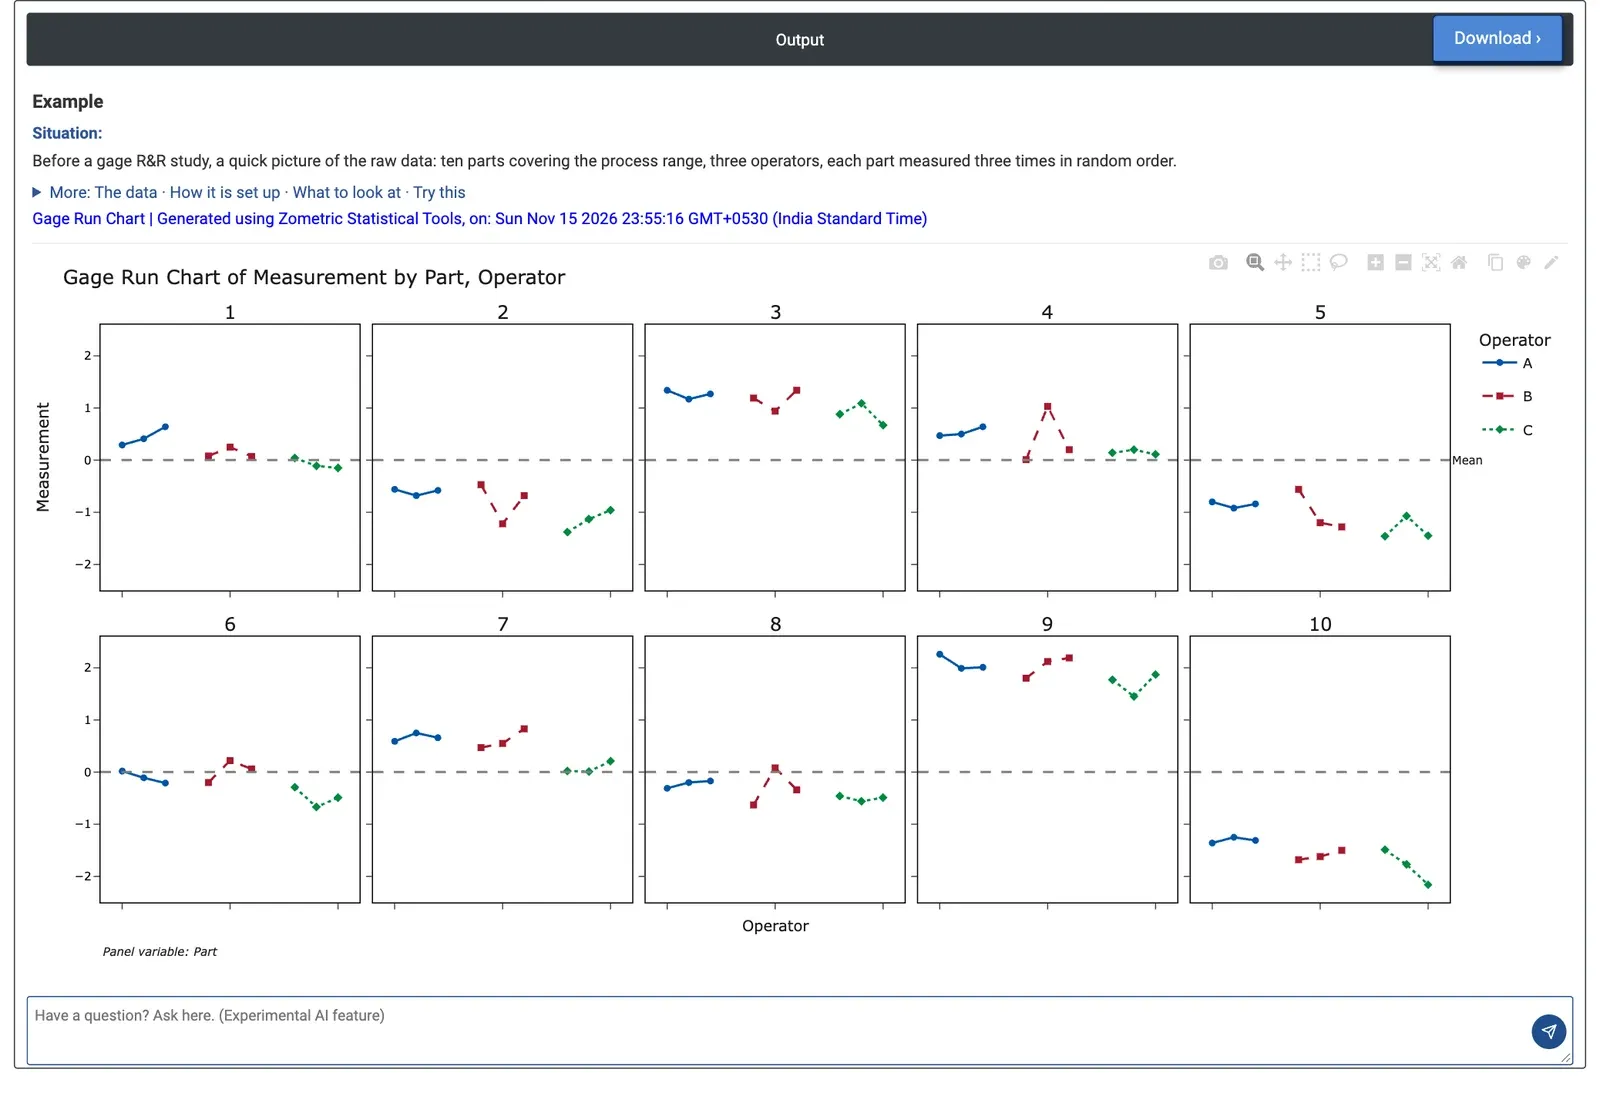
Figure 2 — Ten parts, three operators, three readings each: the parts range from about −1.6 to 1.9, operator B's repeats jump on parts 2, 4, 5 and 8, and operator C reads low on most parts.
Worked Example
Before a gage R&R study, a quality engineer selects ten parts that cover the process range. Three operators (A, B and C) each measure every part three times in random order, 90 readings in all. Part = Part, Operator = Operator, Response = Measurement, no trial column and no historical mean.
The overall mean is 0.001. The panels differ a lot: the part means run from −1.571 (part 10) to 1.940 (part 9), far more than the scatter of the repeats, which is a good sign for the gage. Within the panels, operator A's three readings are close together (average range 0.18), operator C's less so (0.33), and operator B's jump on several parts (average range 0.51; 1.02 on part 4, 0.75 on part 2, 0.72 on part 5 and 0.71 on part 8): a repeatability problem with B's method. Operator C reads lower than A on every part, for example −0.07 against 0.45 on part 1 and −1.81 against −1.31 on part 10; the operator means are 0.190 for A, 0.068 for B and −0.254 for C: a reproducibility problem.
The engineer should watch operator B measure and check how C sets up or reads the gage before relying on the system, then run the Crossed Gage R&R on the same data to put numbers on these impressions.