
General MANOVA
On this page
Purpose
General MANOVA (multivariate analysis of variance) tests whether one or more factors change several related responses together, for example tensile strength and elongation of the same specimens. Use it when you measure two or more properties on each unit: one joint test keeps the overall false-alarm rate at the chosen level, takes the correlation between the responses into account, and can detect a change in the combination of properties that separate ANOVAs miss.
Key Capabilities
- Two or more continuous responses tested jointly against one or more categorical factors.
- Optional continuous covariates and all two-way factor interactions.
- Wilks' lambda, Pillai's trace, Hotelling-Lawley trace and Roy's greatest root for every term.
- Univariate ANOVA for each response (Type III sums of squares).
- Hypothesis and error SSCP matrices with partial correlations, and eigen analysis, on request.
- Data Options: subset the rows before the analysis.
Statistical Methods
The model is the same as in the General Linear Model, fitted to all responses at once: factors with sum-to-zero (−1, 0, +1) coding, covariates as main effects, and the two-way factor interactions when ticked (only with two or more factors). Rows with a missing value in any selected column are dropped. For each term the tool forms the hypothesis matrix H (sums of squares and cross-products explained by the term) and the error matrix E, and tests the term from the eigenvalues λ of E⁻¹H.
Wilks' lambda = det(E) / det(H + E) = Π 1/(1 + λ), small when the term matters; Pillai's trace = Σ λ/(1 + λ); Hotelling-Lawley trace = Σ λ; Roy's greatest root = the largest λ. Each is converted to an approximate F statistic with the numerator and denominator degrees of freedom shown. Pillai's trace is the most tolerant of unequal group sizes and unequal covariance matrices; Roy's root is most sensitive when the groups differ along a single direction, but its F is an upper bound, so its p-value is optimistic.
The eigen analysis lists the eigenvalues of E⁻¹H with their proportions, and eigenvectors scaled so that v'(E / DF error)v = 1. The first eigenvector gives the weighted combination of responses that separates the factor levels most. The univariate tables are Type III ANOVAs of each response on its own. MANOVA assumes independent observations and multivariate normal errors with the same covariance matrix in every group.
Input Fields & Options
Field | Description |
Responses (Y) | Two or more continuous columns, tested jointly. Required. |
Factors (categorical) | One or more categorical predictor columns. Required. |
Covariates (continuous) | Optional numeric columns, entered as main effects only. |
Include all 2-way factor interactions | Ticked by default; enabled only when two or more factors are selected. |
Show univariate ANOVA per response | Ticked by default. |
Matrices (hypothesis, error, partial correlations) | Off by default: adds the SSCP matrices and the partial correlations of the responses. |
Eigen analysis | Off by default: eigenvalues and eigenvectors of E⁻¹H for each term. |
Data Options: Subset (optional) | Exclude matching rows (default) or Include only matching rows, by row numbers and/or a condition. |
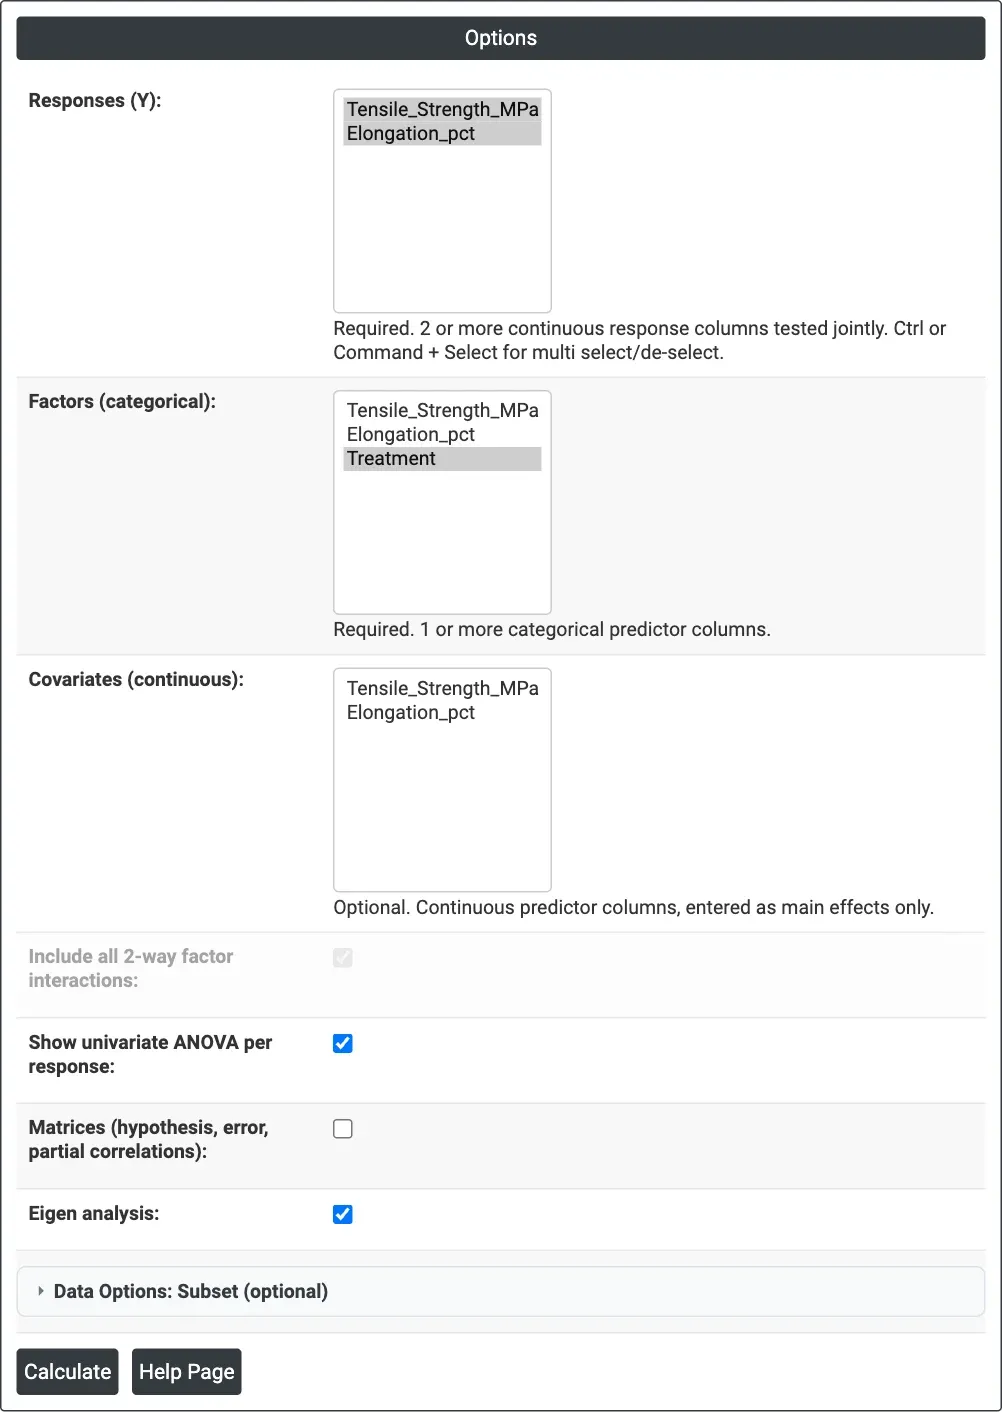
Figure 1 — Options for the materials example: tensile strength and elongation as responses, Treatment as the factor, univariate ANOVA and eigen analysis ticked.
Output Descriptions
- MANOVA — Value, Num DF, Den DF, F Value and P-Value of the four multivariate statistics for each term.
- Univariate Analysis of Variance — one ANOVA table per response.
- SSCP matrices and partial correlations — when Matrices is ticked.
- Eigen Analysis — eigenvalues, proportions, cumulative proportions and eigenvectors for each term, when ticked.
- PDF export via Download.
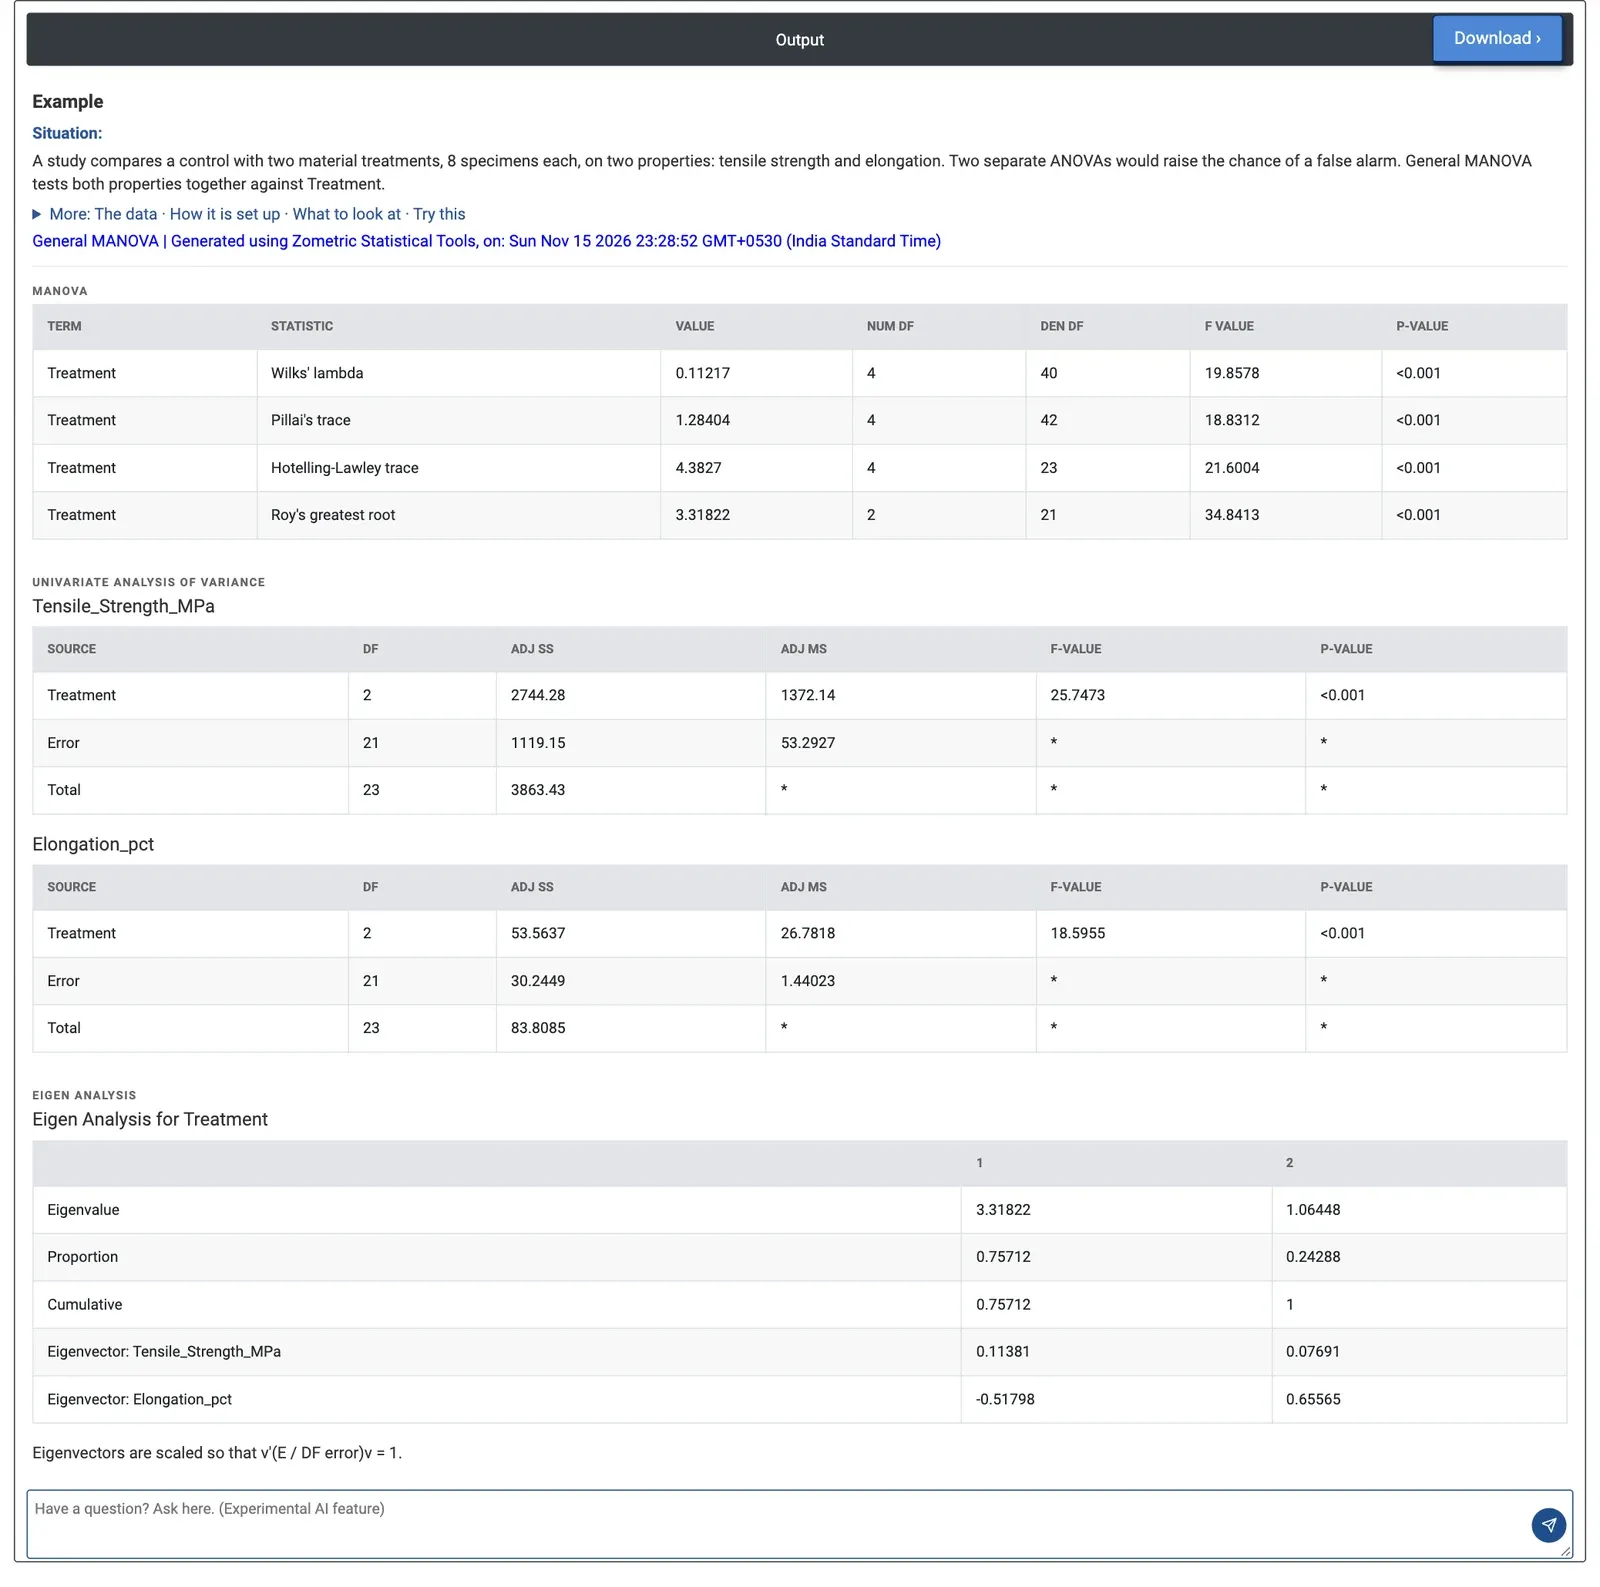
Figure 2 — MANOVA of the two properties: all four statistics reject equal treatment means (Wilks' lambda 0.11217, F = 19.86, p < 0.001).
Worked Example
A materials engineer compares a control with two treatments, A and B, testing 8 specimens of each for tensile strength (MPa) and elongation at break (%). Running two separate ANOVAs would raise the chance of a false alarm, so the engineer tests both properties together, with Treatment as the factor, and ticks the univariate ANOVA and the eigen analysis.
The treatments clearly change the pair of properties: Wilks' lambda is 0.11217 (F = 19.86 on 4 and 40 DF), Pillai's trace 1.28404 (F = 18.83) and all four tests give p < 0.001. The univariate tables show that each property also changes on its own: strength F = 25.75 and elongation F = 18.60, both p < 0.001. Mean strength rises from 211.9 MPa (control) to 225.7 (A) and 238.1 (B); mean elongation is 12.6%, 14.6% and 10.9%.
The eigen analysis explains the pattern. The first direction (75.7% of the separation) weights strength positively (0.114) and elongation negatively (−0.518): the trade-off that sets Treatment B apart, with the most strength but the least ductility. The second direction (24.3%) has positive weights on both, which is how Treatment A differs: it raises strength and elongation together. If the part needs both properties, Treatment A is the safer choice.