
Individuals Chart (I Chart)
On this page
Purpose
The Individuals Chart (I chart) monitors a process measured one value at a time: one bottle, one batch, one daily reading. It plots each value in time order against a centre line and control limits based on the variation between consecutive values, and flags points and patterns that suggest a special cause. Use it when there are no natural subgroups; to watch the short-term variation as well, use the I-MR chart.
Key Capabilities
- Control limits from the average or median moving range or the square root of the MSSD, or from a known mean and standard deviation.
- All eight Nelson tests, each with an adjustable K; failing points are marked and listed in a table.
- Extra lines at multiples of σ (±2σ by default), specification limits and limit bounds.
- Stages with separate limits, and limits estimated from chosen observations only.
- Up to 10 columns at once, one chart each; optional guided interpretation.
Statistical Methods
The centre line is the mean x̄ of the observations (or the Process mean entered). The process standard deviation σ (or the Process sd entered) is estimated from the variation between neighbouring observations, so that a drift or shift does not inflate it. With the default Average moving range and length 2, each moving range is MRᵢ = |xᵢ − xᵢ₋₁| and σ = MR̄ / d₂, with d₂ = 1.128. A longer Length moving range uses the range (maximum − minimum) of that many consecutive points and the matching d₂. Median moving range uses σ = median(MR) / d₄ (0.954 for length 2), which is less affected by a few large jumps. Square Root of MSSD uses σ = √[Σ(xᵢ₊₁ − xᵢ)² / (2(n − 1))], divided by the constant c₄′(n) when Use unbiasing constant is ticked.
The control limits are UCL = x̄ + Kσ and LCL = x̄ − Kσ, where K is the K for Rule 1 (default 3). The optional bounds clamp them: the LCL is never below the lower bound and the UCL never above the upper bound. Additional lines are drawn at x̄ ± mσ for the multiples entered. With stages, the mean, σ and limits are calculated separately within each stage. With Specify subgroups to estimate parameters, only the listed observations (Use) or all but the listed observations (Omit) are used to estimate x̄ and σ.
The Nelson tests, with their default K: 1, one point more than 3σ from the centre line; 2, 9 points in a row on the same side; 3, 6 points in a row all increasing or all decreasing; 4, 14 points in a row alternating up and down; 5, 2 out of 3 points more than 2σ from the centre line on the same side; 6, 4 out of 5 points more than 1σ on the same side; 7, 15 points in a row within 1σ; 8, 8 points in a row more than 1σ from the centre line on either side. Each signal is a reason to look for a cause, not proof of one.
Input Fields & Options
Field | Description |
Individual value column(s) | Required. One or more numeric columns (up to 10), each charted separately in row order; at least 5 values each. |
Process mean / Process sd | Optional. Known values used instead of estimating from the data. |
Sd estimation method | Average moving range (default), Median moving range or Square Root of MSSD. |
Use unbiasing constant | Ticked by default. Applies to the Square Root of MSSD method only. |
Batch/Lot | Optional text shown in a study information table. |
Show decimals | Decimals shown in the limit labels, 1 to 7 (default 3). |
Length moving range | Default 2; 2 to 100. Number of consecutive points in each moving range (moving-range methods only). |
Chart title / Chart y axis label | Optional. Default: the column name. |
LSL / USL | Optional specification limits drawn on the chart. |
Check Rule 1–8 / K for Rule 1–8 | All eight Nelson tests are on by default, with K = 3, 9, 6, 14, 2, 4, 15 and 8. K for Rule 1 also sets the width of the control limits. |
Additional CLs at multiples of sd 1 / sd 2 | Extra lines at ± these multiples of σ. Default: empty and 2. |
Define stages (historical groups) with this variable | Optional column marking stages; limits are calculated per stage. |
X scale | Optional column used to label the horizontal axis (e.g. dates). |
Lower / Upper standard deviation limit bound | Optional. The LCL will not go below, and the UCL not above, these values. |
Include or Exclude / Specify which rows | All rows by default, or include or exclude the row numbers given (e.g. 4 7 11:14). |
Specify subgroups to estimate parameters / Subgroups | Omit (default) or Use the listed observations (e.g. 3 12:15) when estimating the mean and σ; all observations are still plotted. |
Show guided interpretation | Adds a Summary Report, Diagnostic Report and Report Card. Off by default. |
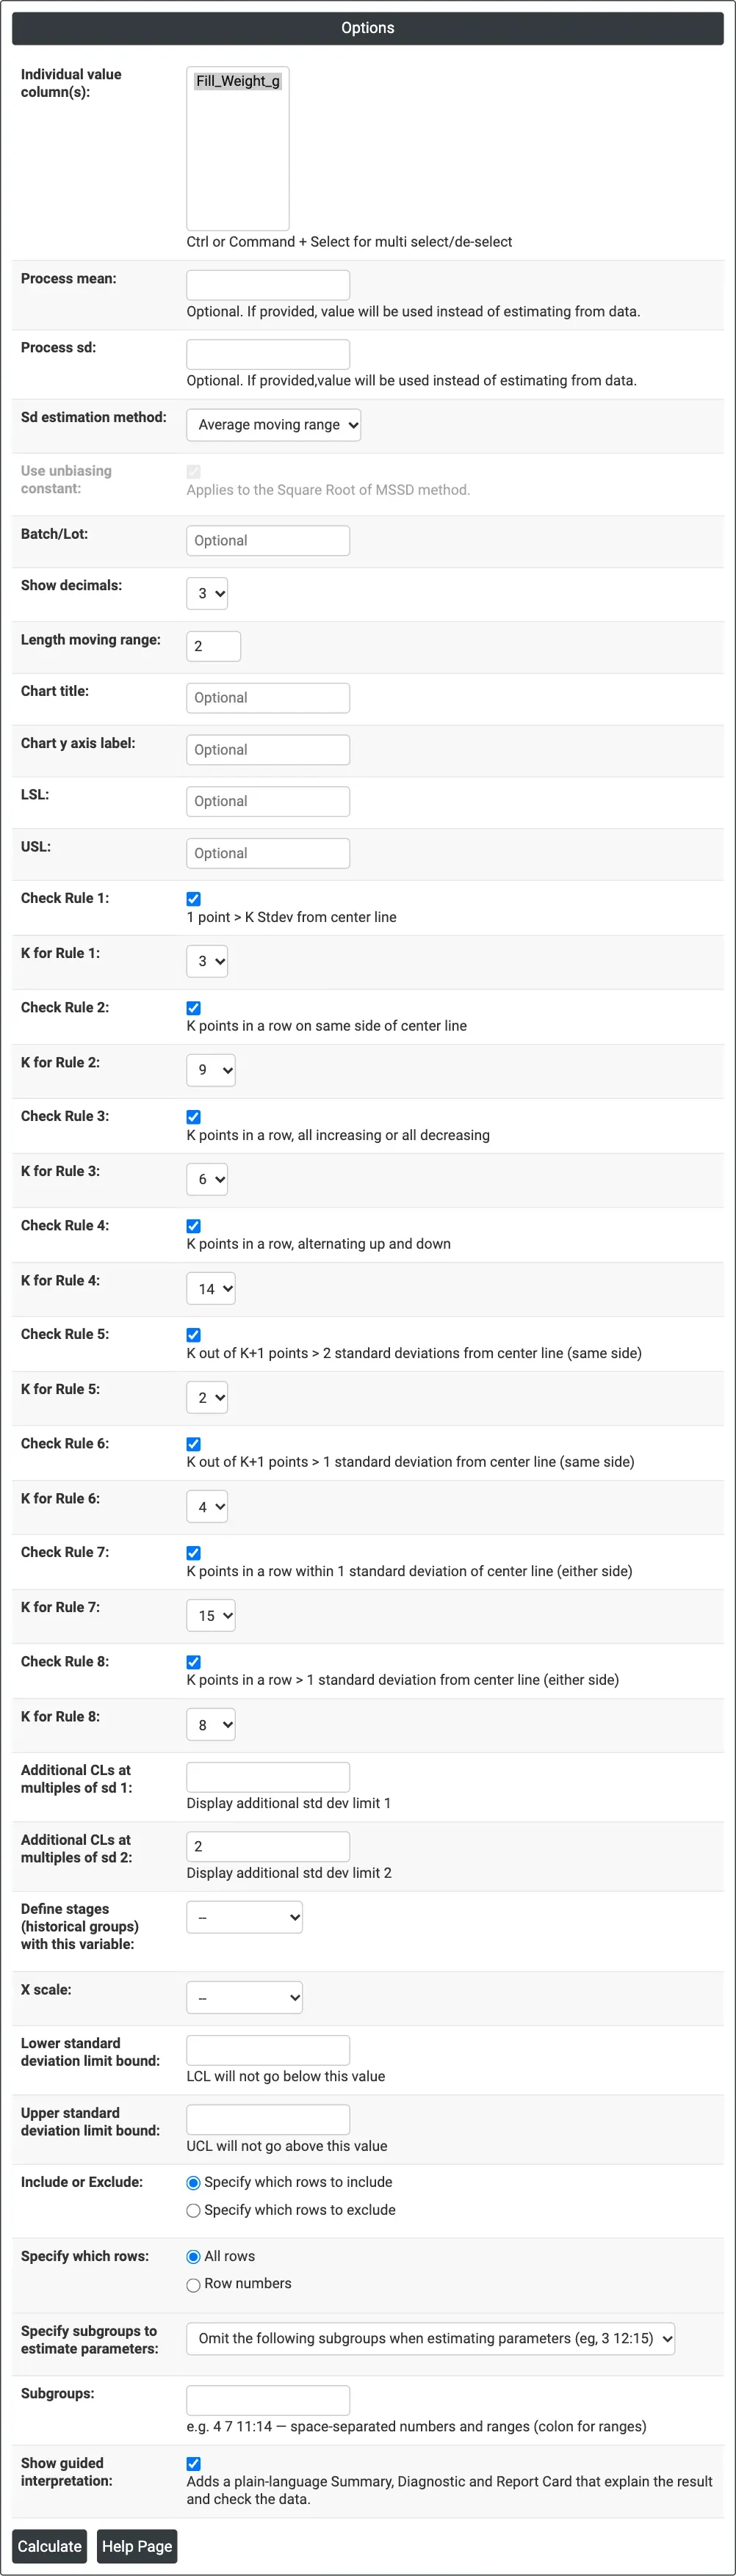
Figure 1 — Options for the example: Fill_Weight_g with the average moving range, all eight Nelson tests, ±2σ lines and the guided interpretation.
Output Descriptions
- IChart @ <column> — the observations in order with the centre line (CL), control limits (UCL, LCL), the additional σ lines and any specification limits; failing points are marked in red with their test numbers.
- Nelson's Rules table — each test that failed and the observation numbers of the potential special-cause points.
- Summary Report — I chart and a table of N, Mean, StDev(overall) and StDev(within) (guided interpretation only).
- Diagnostic Report and Report Card — what to look for in the chart and checks on patterns and trends (guided interpretation only).
- PDF export via Download.
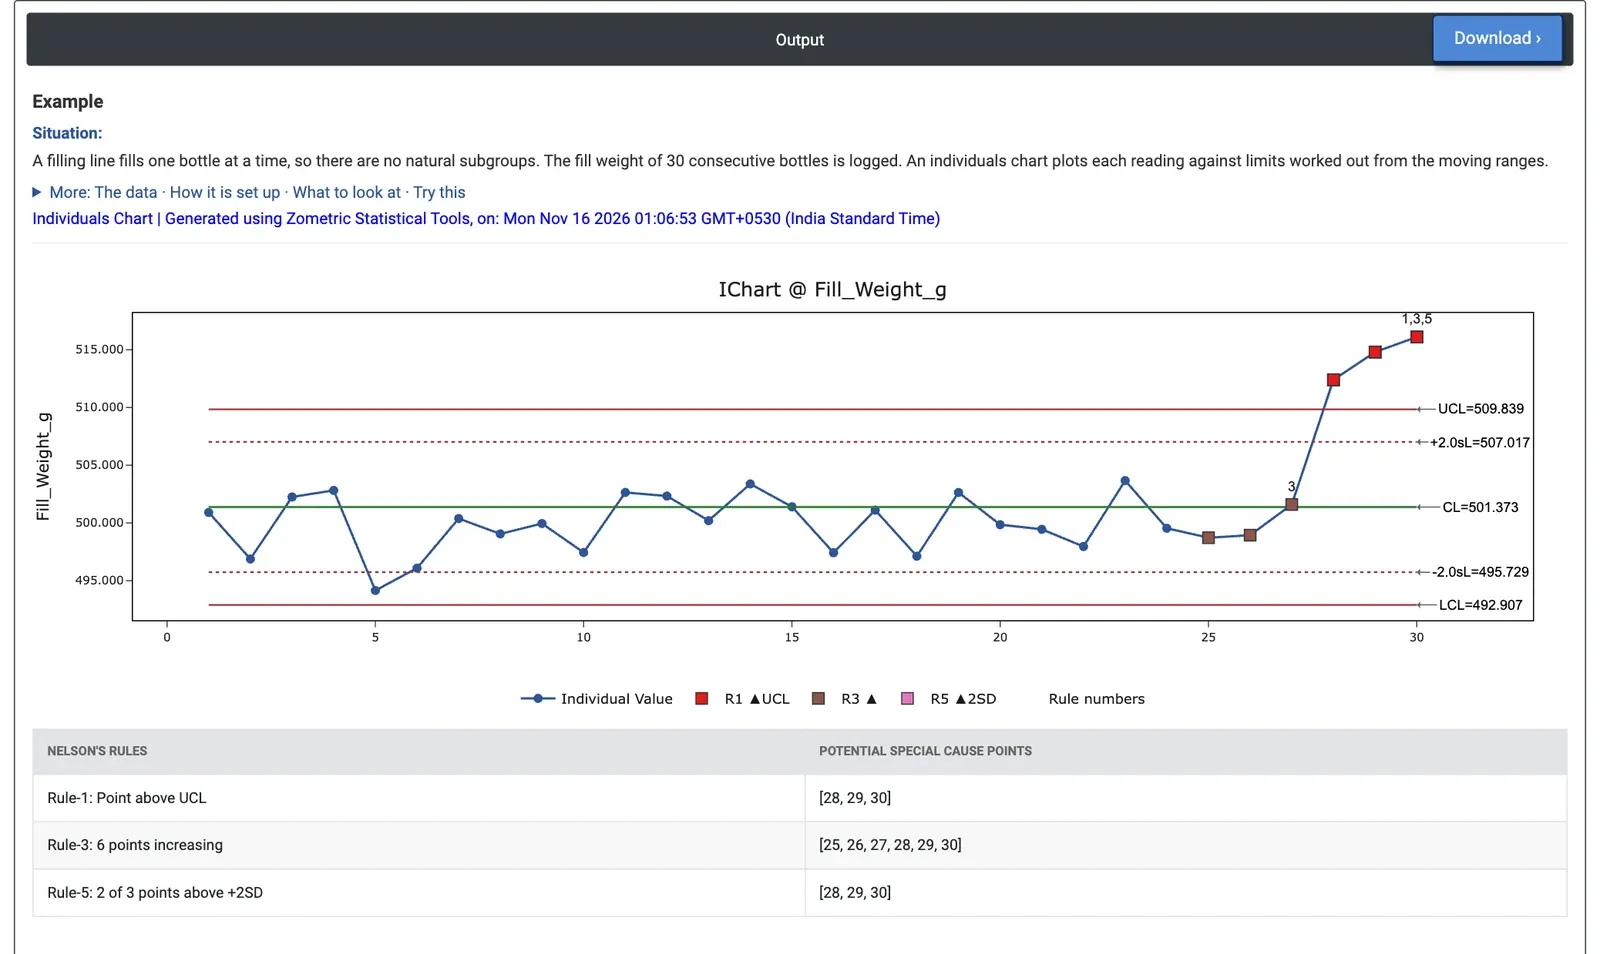
Figure 2 — I chart of the fill weight of 30 consecutive bottles: the last three are above the UCL and the last six rise in a row.
Worked Example
A filling line fills one bottle at a time, so there are no natural subgroups. The line supervisor logs the fill weight of 30 consecutive bottles and wants to know whether the filler is stable. Individual value column(s) = Fill_Weight_g, Sd estimation method = Average moving range, all eight Nelson tests on, Show guided interpretation ticked.
The centre line is 501.373 g. The average moving range is 3.183 g, so σ(within) = 3.183 / 1.128 = 2.822 g and the control limits are 492.907 to 509.839 g. The first 24 bottles stay between 494.15 and 503.67 g with no signals: common-cause variation only. Then bottles 28, 29 and 30 (512.4, 514.8 and 516.1 g) are above the UCL (Rule 1) and also fail Rule 5, and bottles 25 to 30 rise six times in a row (Rule 3). The overall standard deviation, 5.012 g, is much larger than the within value of 2.822 g, another sign that the mean has moved.
The filler is drifting upward and should be stopped and adjusted before the whole batch is overfilled (product giveaway). Because the drift itself raises the mean, the limits are better estimated from the stable period: with Specify subgroups to estimate parameters = Use and Subgroups = 1:24, the centre line becomes 499.943 g and the limits 491.373 to 508.513 g, and the same bottles are flagged. Those limits can then be kept for monitoring the line after the adjustment.