
Interaction Plot
On this page
Purpose
The Interaction Plot shows whether the effect of one factor on a response depends on the level of another factor. It plots the mean response at each level of one factor, with a separate line for each level of the second factor. Parallel lines mean the factors act independently; lines that converge or cross mean they interact, and the best setting of one factor depends on the other. Use it with designed experiments, General Linear Model or two-way ANOVA, before deciding on settings.
Key Capabilities
- One plot per response; several responses can be selected at once.
- Two factors give a single panel: the first factor on the X axis, one line per level of the second.
- Three or more factors give a matrix of panels, one for each pair of factors.
- Full matrix option draws every pair both ways round, so each factor appears once on the X axis and once as the lines.
- Works on data means: no model is fitted, so it can be used on any data with categorical or numeric factor levels.
Statistical Methods
For each pair of factors (A on the X axis, B as lines), rows with a blank response or factor level are dropped and the response is averaged within every A × B combination. Each line joins the cell means ȳᵢⱼ for one level j of B across the levels i of A. Levels are sorted in their natural order (numbers numerically, text alphabetically). The plot title says “Data Means” because the points are raw cell means, not fitted values from a model.
Reading the plot: if the lines are parallel, the change in the mean from one level of A to the next is the same at every level of B, so there is no interaction. Non-parallel or crossing lines mean the effect of A changes with B. With unequal numbers of observations in the cells, or many cells, apparent differences can be noise; whether an interaction is statistically significant is tested with a two-way ANOVA or General Linear Model that includes the A×B term.
With two factors only the panel with the first factor on the X axis is drawn, unless the full matrix option is ticked. With three or more factors the panels form the upper triangle of a matrix (factor j on the X axis, factor i as lines, for j > i); the full matrix adds the lower triangle.
Input Fields & Options
Field | Description |
Responses | Required. One or more numeric response columns (Ctrl or Command + click for several). One plot is drawn per response. |
Factors | Required. At least 2 columns. Their order matters: with two factors the first is on the X axis and the second gives the lines. Three or more are drawn as a matrix. |
Display full interaction plot matrix | Off by default. Also draws each pair with the factors swapped. |
Data Options: Subset (optional) | Exclude matching rows (default) or Include only matching rows; Row numbers (e.g. 3,7,12-15) and/or a Condition (e.g. MetalType == 1) select the rows. |
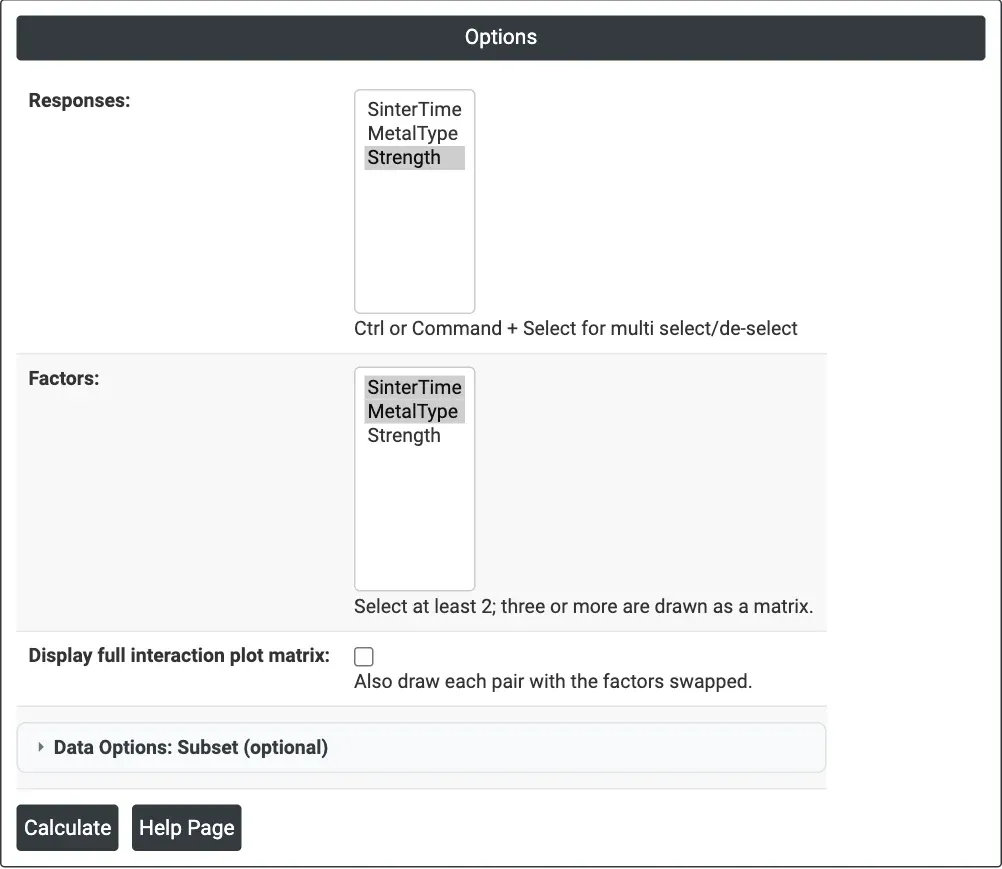
Figure 1 — Options for the example: Responses = Strength, Factors = SinterTime and MetalType.
Output Descriptions
- Interaction Plot for <response> (Data Means) — mean response against the levels of the X-axis factor, one coloured line per level of the other factor, with a legend; a matrix of such panels for three or more factors or with the full matrix ticked.
- PDF export via Download.
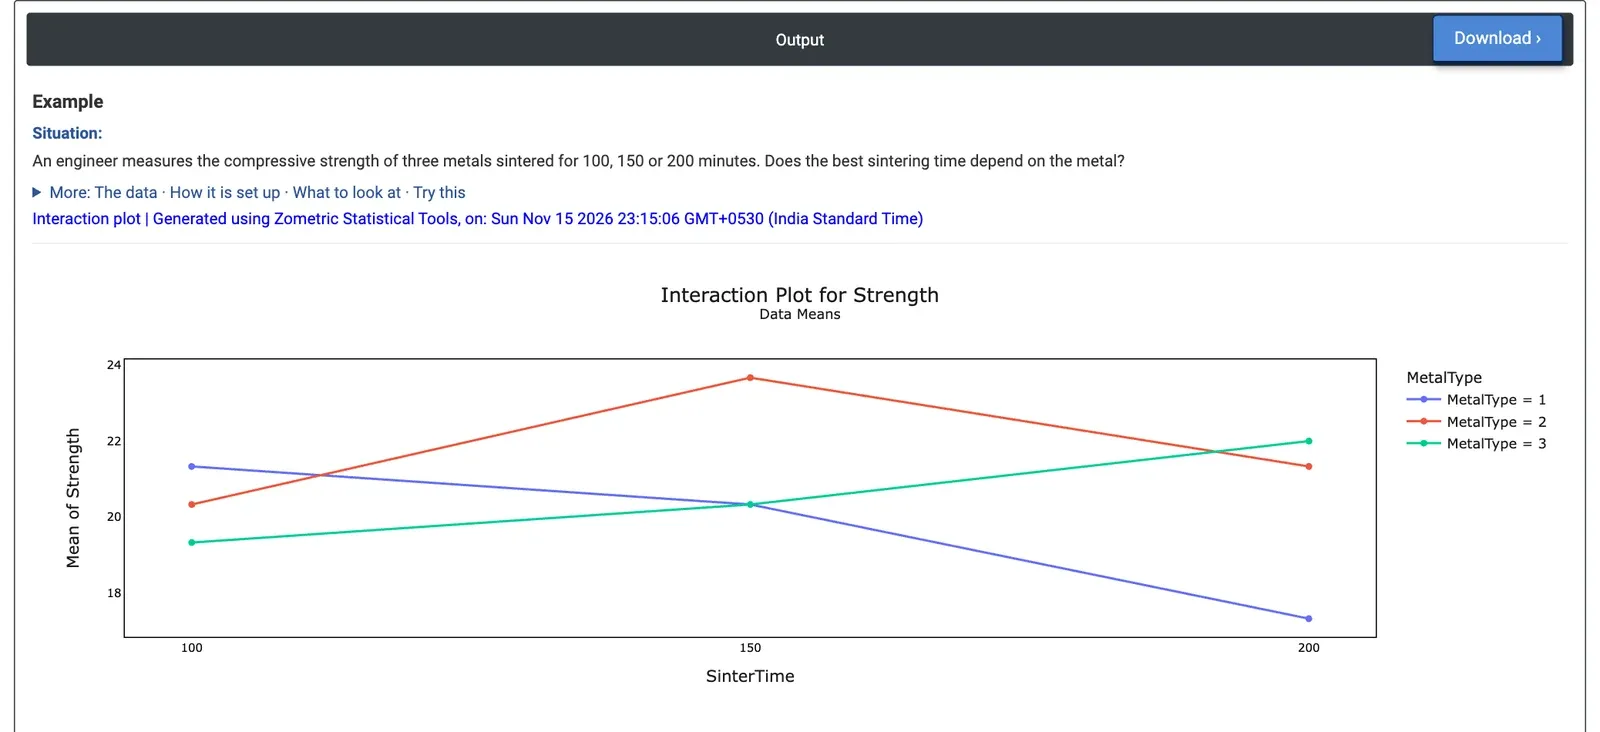
Figure 2 — Interaction Plot for Strength: mean strength against sintering time, one line per metal type. The lines cross.
Worked Example
An engineer measures the compressive strength of three metals (MetalType 1, 2 and 3) sintered for 100, 150 or 200 minutes, with three specimens per combination: 27 results. The question is whether one sintering time is best for all three metals. Responses = Strength and Factors = SinterTime, MetalType.
The lines cross, a clear interaction. Metal 1 gets weaker with longer sintering (mean 21.33, 20.33 and 17.33 at 100, 150 and 200 minutes). Metal 3 gets stronger (19.33, 20.33 and 22.00). Metal 2 peaks at 150 minutes with 23.67, the strongest combination overall. Averaged over the metals, the three times differ little (20.33, 21.44 and 20.22), so a main effects plot alone would suggest sintering time hardly matters; the interaction plot shows that it matters a great deal, but in opposite directions for different metals.
There is therefore no single best sintering time: the setting has to be chosen per metal (200 minutes for metal 3, 150 for metal 2, 100 for metal 1). A two-way ANOVA with the interaction term confirms it: SinterTime × MetalType has p = 0.008. Ticking Display full interaction plot matrix adds a second panel with metal type on the X axis and one line per sintering time, showing the same means the other way round.