
Interval Plot
On this page
Purpose
The Interval Plot shows the mean of a response for each level of a grouping variable, with an interval bar around each mean: a confidence interval for the mean or a multiple of its standard error. It gives a quick picture of which groups (suppliers, machines, shifts) are likely to differ and how precisely each mean is known, before a formal test such as One-Way ANOVA.
Key Capabilities
- One mean and interval bar per group, with the means joined by a line, plus a table of N, Mean, StDev and the interval limits.
- Confidence interval at any level (default 95%), or mean ± a chosen number of standard errors.
- Bonferroni option, so that all the intervals together hold the chosen confidence level.
- Two-sided intervals, or upper or lower one-sided bounds.
- Each group's own standard deviation, or a pooled standard deviation across groups.
Statistical Methods
Rows with a blank response or group are dropped. For each group i the tool computes the size nᵢ, the mean ȳᵢ and the sample standard deviation sᵢ, and the standard error SEᵢ = sᵢ / √nᵢ with nᵢ − 1 degrees of freedom. With Pool error across groups ticked, every group uses the pooled standard deviation sₚ = √[Σ(nᵢ − 1)sᵢ² / (N − k)], with N − k degrees of freedom (N observations, k groups), so all groups of the same size get bars of the same length.
For a confidence interval at level C, α = 1 − C/100 and the bar is ȳᵢ ± t × SEᵢ, with t the 1 − α/2 quantile of Student's t for a two-sided interval and the 1 − α quantile for a one-sided bound. With Bonferroni, α is divided by the number of groups k, which widens every bar so that the chance that all k intervals cover their true means is at least C. For the Standard error type the bar is ȳᵢ ± m × SEᵢ, where m is the Multiple (default 1); such bars are not confidence intervals.
Non-overlapping 95% intervals suggest the means differ; overlapping ones do not prove they are equal. The plot is a guide, and One-Way ANOVA with a comparison method is the formal test.
Input Fields & Options
Field | Description |
Y (response) | Required. Numeric response column. |
X (categorical grouping) | Required. Column whose levels form the groups. |
Type of interval | Confidence interval (default) or Standard error. |
Level | Confidence level in percent, default 95. Used for Confidence interval only. |
Bonferroni | Off by default. Controls the simultaneous confidence level of all the intervals. Confidence interval only. |
Multiple | Number of standard errors, default 1. Used for Standard error only. |
Side | Two-sided (default), Upper one-sided (bars above the mean only) or Lower one-sided (bars below the mean only). |
Pool error across groups | Off by default. Uses the pooled standard deviation and degrees of freedom instead of each group's own. |
Data Options: Subset (optional) | Exclude matching rows (default) or Include only matching rows; Row numbers (e.g. 3,7,12-15) and/or a Condition (e.g. Supplier != "Supplier D") select the rows. |
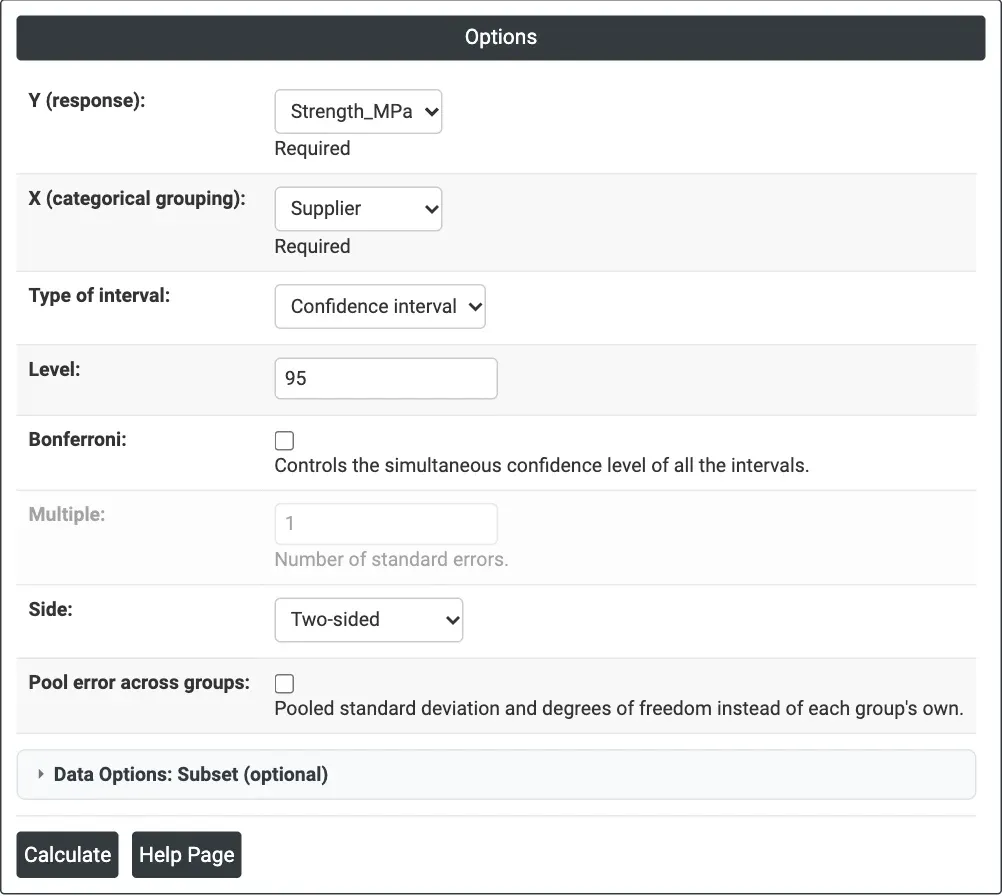
Figure 1 — Options for the example: Strength_MPa by Supplier, two-sided 95% confidence intervals with each supplier's own standard deviation.
Output Descriptions
- Interval Plot of <Y> vs <X> — each group mean with its interval bar, the means joined by a line; the subtitle states the interval type and whether individual or pooled standard deviations were used.
- Means — per group: N, Mean, StDev, Lower and Upper limits of the interval (shown as * for the side not calculated with a one-sided bound).
- PDF export via Download.
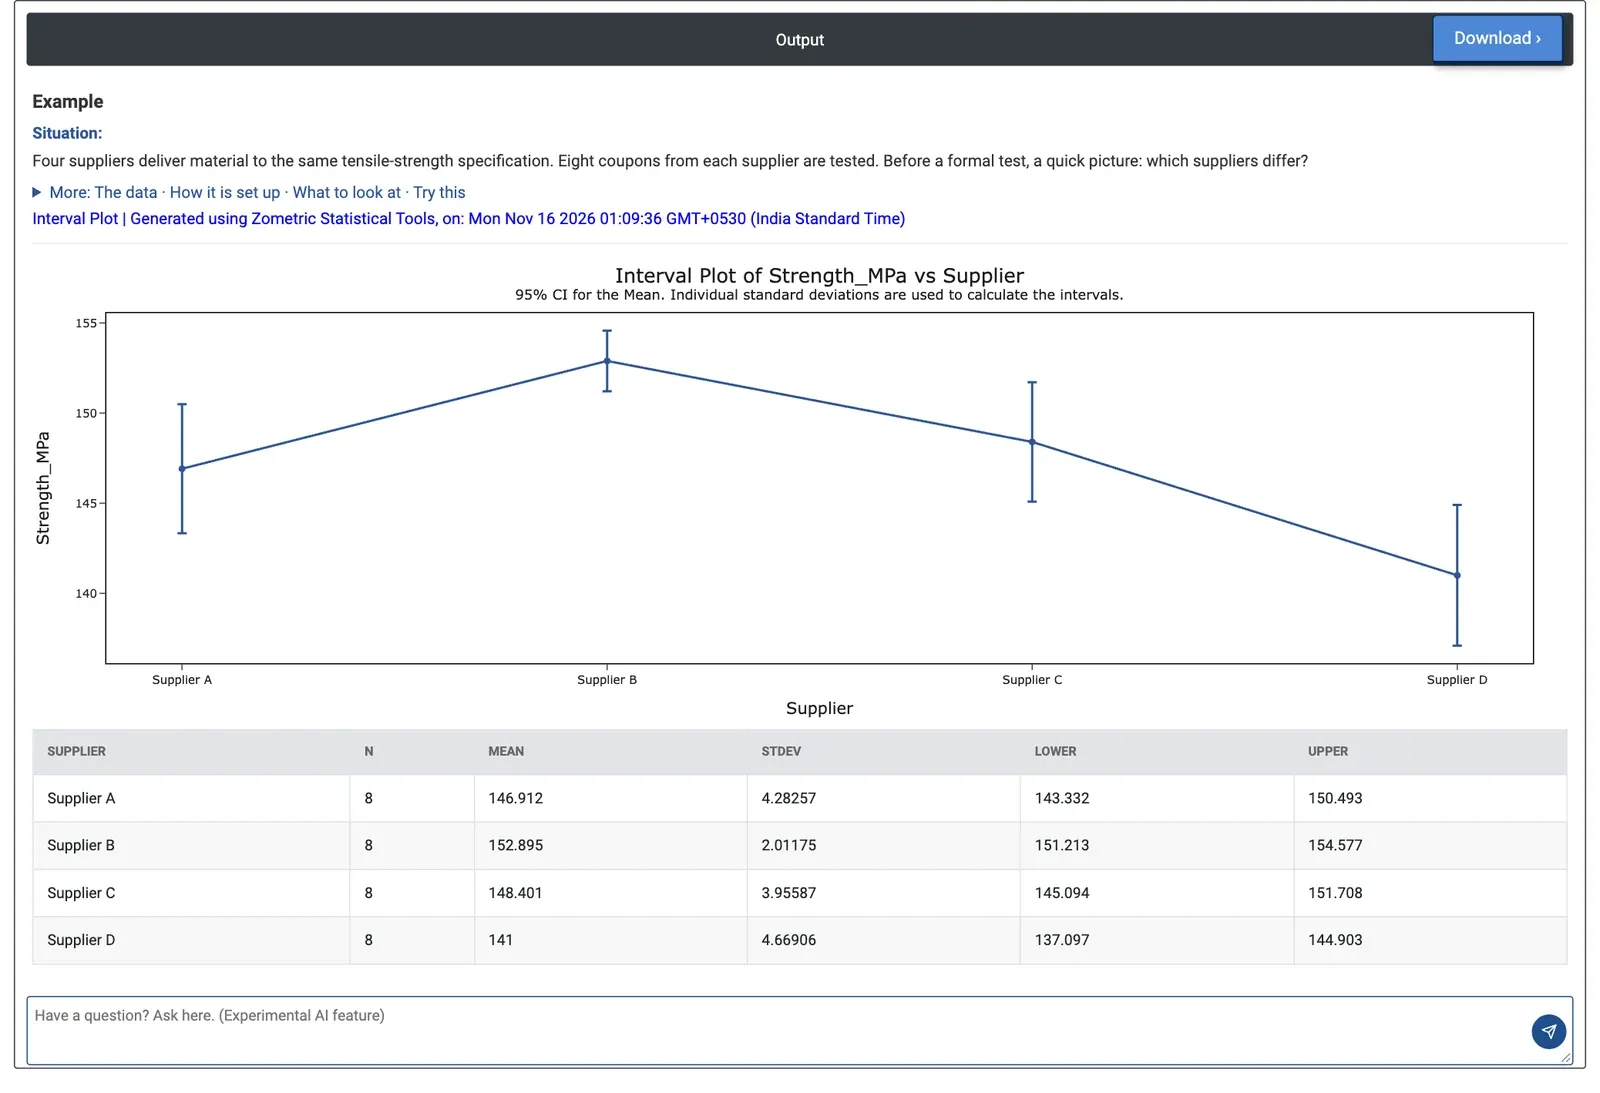
Figure 2 — 95% confidence intervals for the mean tensile strength of four suppliers, eight coupons each, with the table of means and limits.
Worked Example
Four suppliers deliver material to the same tensile-strength specification. Eight coupons from each supplier are tested, and the quality engineer wants a first picture of which suppliers differ. Y (response) = Strength_MPa, X (categorical grouping) = Supplier, Type of interval = Confidence interval at Level 95, two-sided, without pooling.
Supplier B has the highest mean, 152.895 MPa (95% interval 151.213 to 154.577), and the smallest spread (StDev 2.01). Supplier D has the lowest, 141 MPa (137.097 to 144.903); its interval does not overlap B's or C's (145.094 to 151.708), so D is probably weaker than both. Supplier A (143.332 to 150.493) overlaps C and D and cannot be separated from them by eye.
Because four intervals are compared at once, ticking Bonferroni gives a fairer picture: the bars widen (Supplier D becomes 135.494 to 146.506, Supplier B 150.523 to 155.267), and D and B still do not overlap. Pooling the error gives every supplier the same half-width of about 2.80 MPa. One-Way ANOVA on the same two columns gives p < 0.001, so at least one supplier differs; the engineer would follow up with Supplier D on its process before the next delivery.