
Item Analysis
On this page
Purpose
Item Analysis checks whether several questions or check items measure the same thing, so that their scores can be added into one total. Use it before you combine the questions of a customer or employee survey, the items of a training test or the points of an audit checklist into a single score, and to find items that do not fit with the rest.
Key Capabilities
- Cronbach's alpha for the whole set of items.
- For each item: mean, standard deviation, item-total correlation, squared multiple correlation and Cronbach's alpha if the item is deleted.
- Correlation matrix of all items.
- Any number of items; respondents with a missing answer are left out.
Statistical Methods
Only respondents with a numeric answer to every selected item are used (N in the output). For k items with variances sᵢ² and total score variance s_T², Cronbach's alpha = k/(k − 1) × (1 − Σsᵢ² / s_T²). Alpha rises when the items are positively correlated with each other, and with the number of items. As a common guide, 0.7 is the usual minimum for a combined score and above 0.8 is good; a very high alpha (above about 0.95) may mean some items repeat each other.
The item-total correlation is the correlation of an item with the sum of the other items (the corrected item-total correlation): a low or negative value shows an item that does not move with the rest, or one that is scored in the opposite direction. The squared multiple correlation is the R² of a regression of the item on all the other items. Alpha if Deleted is Cronbach's alpha of the remaining k − 1 items: if it is higher than the overall alpha, dropping that item makes the score more consistent.
The correlation matrix gives the Pearson correlation of every pair of items. Item analysis measures internal consistency only; it does not show that the score measures what you intend (validity).
Input Fields & Options
Field | Description |
Items (variables) | Select 2 or more numeric columns (survey or test items). Ctrl or Command + click to select several. |
Title | Title shown as the heading of the output; default Item Analysis. |
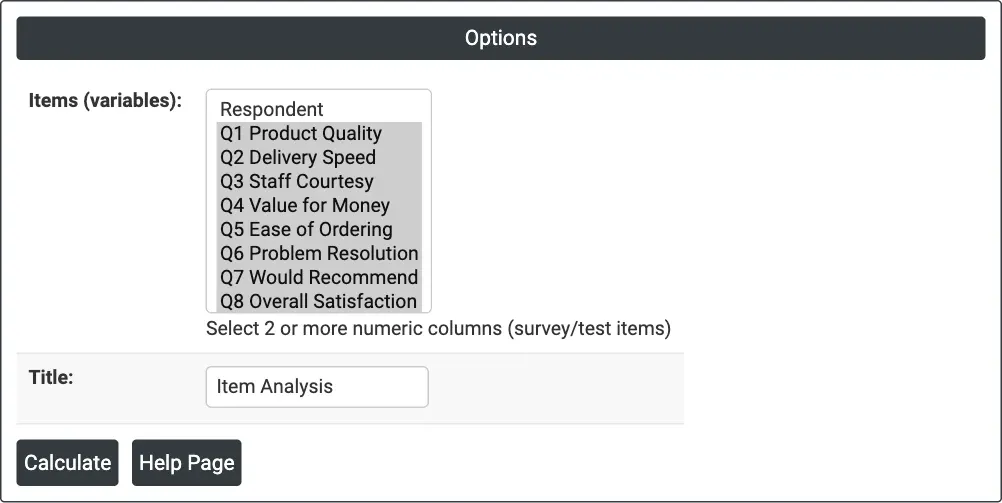
Figure 1 — Options for the survey example: the eight question columns Q1 Product Quality to Q8 Overall Satisfaction selected as items.
Output Descriptions
- Title — the Title entered, as the heading of the output.
- N and number of items, and Cronbach's Alpha.
- Item Statistics — Mean, StdDev, Item-Total Corr, Squared Multiple Corr and Alpha if Deleted for each item.
- Correlation Matrix — Pearson correlations between the items.
- PDF export via Download.
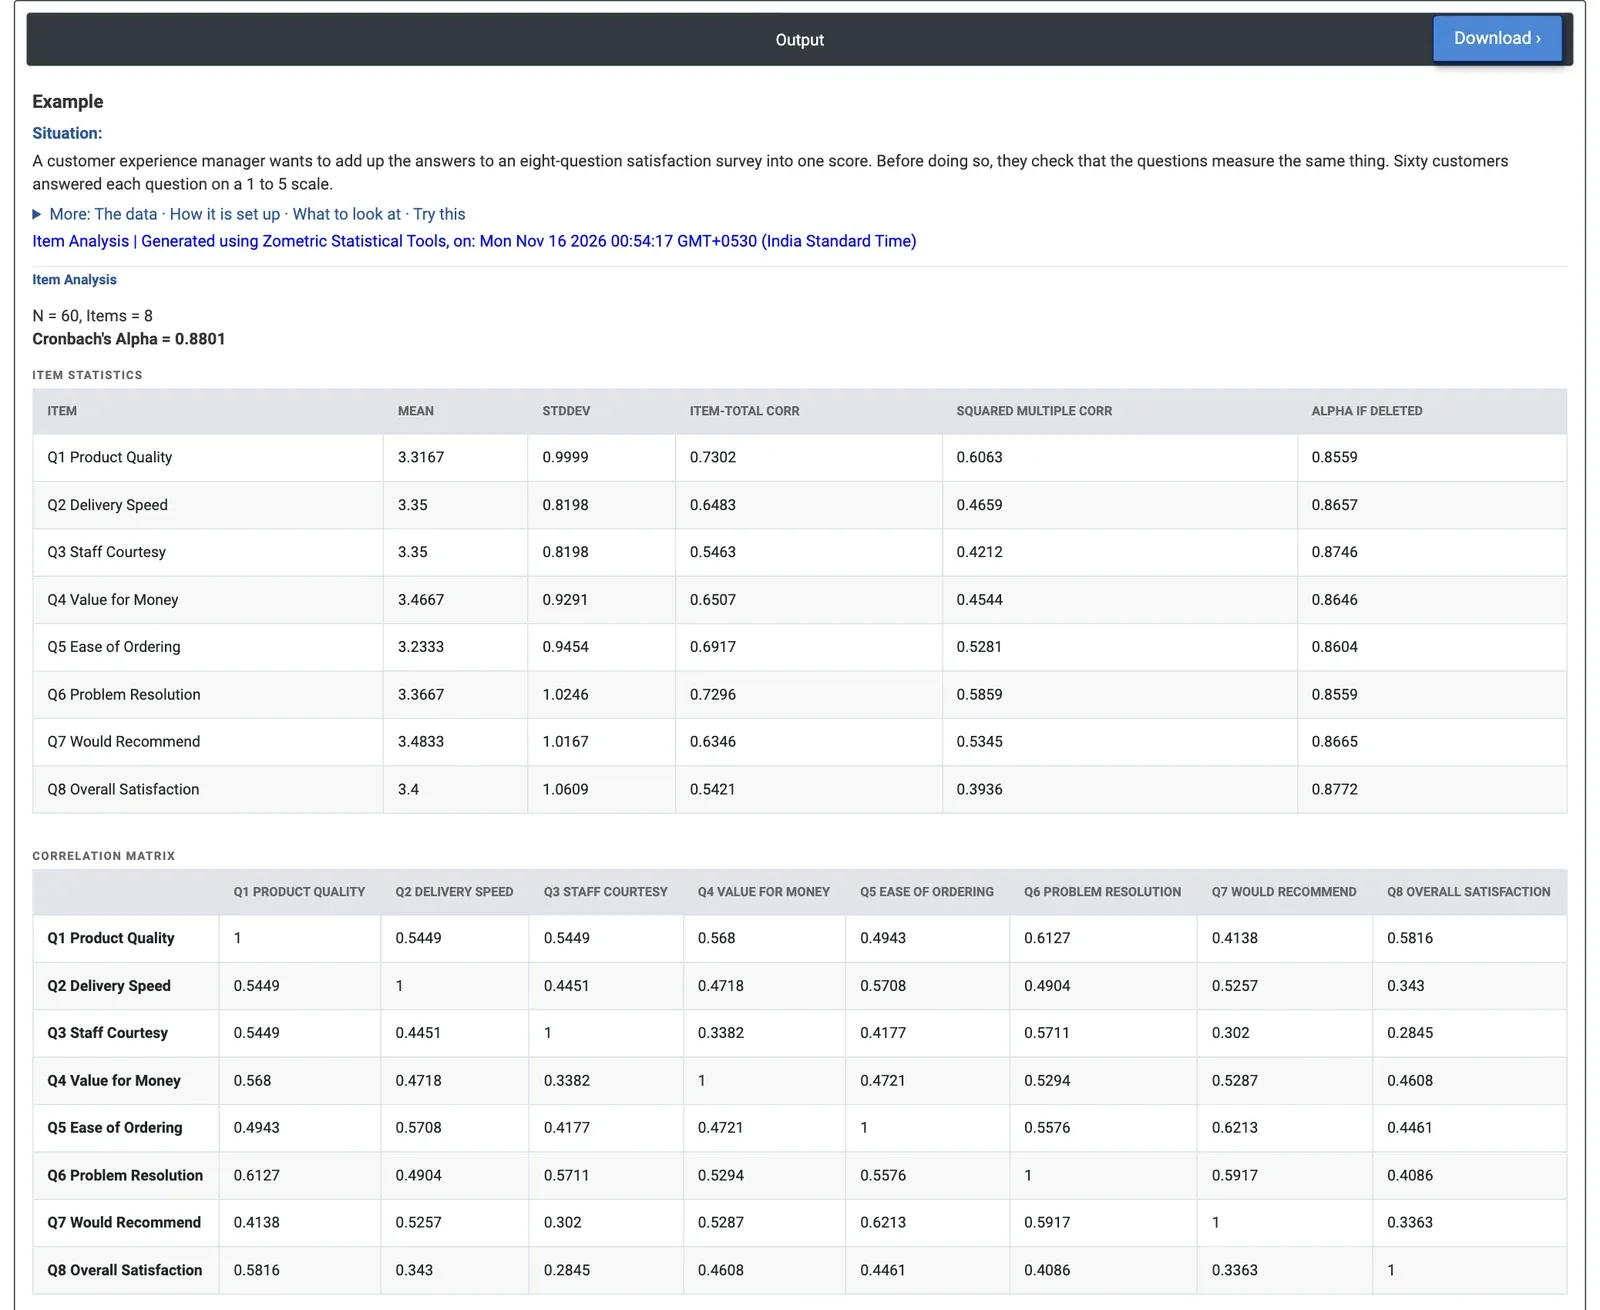
Figure 2 — Item analysis of the eight survey questions: Cronbach's alpha 0.8801, and Alpha if Deleted is lower than that for every item.
Worked Example
A customer experience manager wants to add up the answers to an eight-question satisfaction survey (scores 1 to 5) into one score, and first checks that the questions measure the same thing. Sixty customers answered every question. The manager selects the columns Q1 Product Quality to Q8 Overall Satisfaction as the items; the Respondent column is not used.
Cronbach's alpha is 0.8801, well above the usual minimum of 0.7: the eight questions are consistent. The item-total correlations run from 0.5421 (Q8 Overall Satisfaction) and 0.5463 (Q3 Staff Courtesy) to 0.7302 (Q1 Product Quality) and 0.7296 (Q6 Problem Resolution), so every question moves with the total of the others. In the correlation matrix all pairs are positive, from 0.2845 (Q3 with Q8) to 0.6213 (Q5 with Q7).
Alpha if Deleted is below 0.8801 for every question, from 0.8559 to 0.8772, so removing any question would make the score slightly less consistent. The manager keeps all eight questions and reports the summed score. Removing Q8 would leave alpha at 0.8772, almost unchanged, so Q8 could be reported on its own if a shorter overall score were needed.