
Lag
On this page
Purpose
Lag shifts a series down by a set number of rows, so that each row shows the value from k periods earlier. It puts last month's (or last batch's, last shift's) value next to this one. Use it to test a delayed effect, for example whether last month's advertising, last shift's temperature or the previous batch's raw material property relates to today's result, or to build lagged inputs for a regression model.
Key Capabilities
- Lags from 1 to 365 rows.
- Plot of the original series and the lagged series together, so the shift is visible.
- Table with the row number, the original value and the lagged value for every row; the first k rows show *.
- Keeps gaps in place: a missing value stays missing in its shifted position.
Statistical Methods
For a series y₁ … yₙ and lag k, the lagged value in row t is yₜ₋ₖ for t = k + 1 … n; the first k rows have no earlier value and are shown as *. Nothing is estimated: the column is simply shifted, so the lagged column has the same length as the original and lines up row by row with the other columns of the worksheet. The series needs more than k values.
Lagging is a step before an analysis, not a test in itself. Correlating an output with a lagged input (or regressing on it) measures the delayed relationship; the difference between a series and its lag 1 is the first difference (see the Differences tool). To see the correlation at many lags at once, use the Cross Correlation Function; for a series against its own past, the Autocorrelation Function. When an input and an output both trend or follow the same season, they correlate at every lag, so compare the same-period and lagged correlations rather than reading either one on its own.
Input Fields & Options
Field | Description |
Variable | Required. The numeric column to shift, in time order. |
Lag | Required, 1 to 365, default 1. Number of rows the series is shifted down. |
Title | Title shown on the graph. Default Lag. |
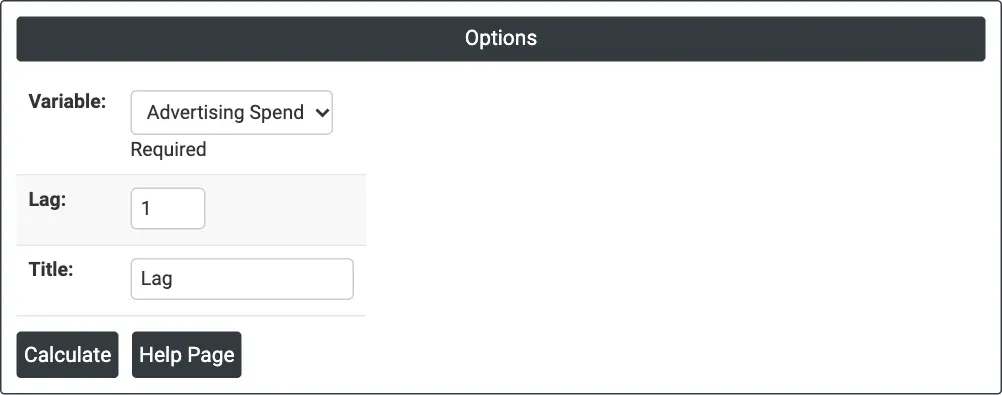
Figure 1 — Advertising Spend lagged by one month.
Output Descriptions
- Lag (graph) — the original series (solid) and the lagged series (dashed) against the row index.
- Lagged Values (table) — Row, the original column and Lag k for every row.
- PDF export via Download.
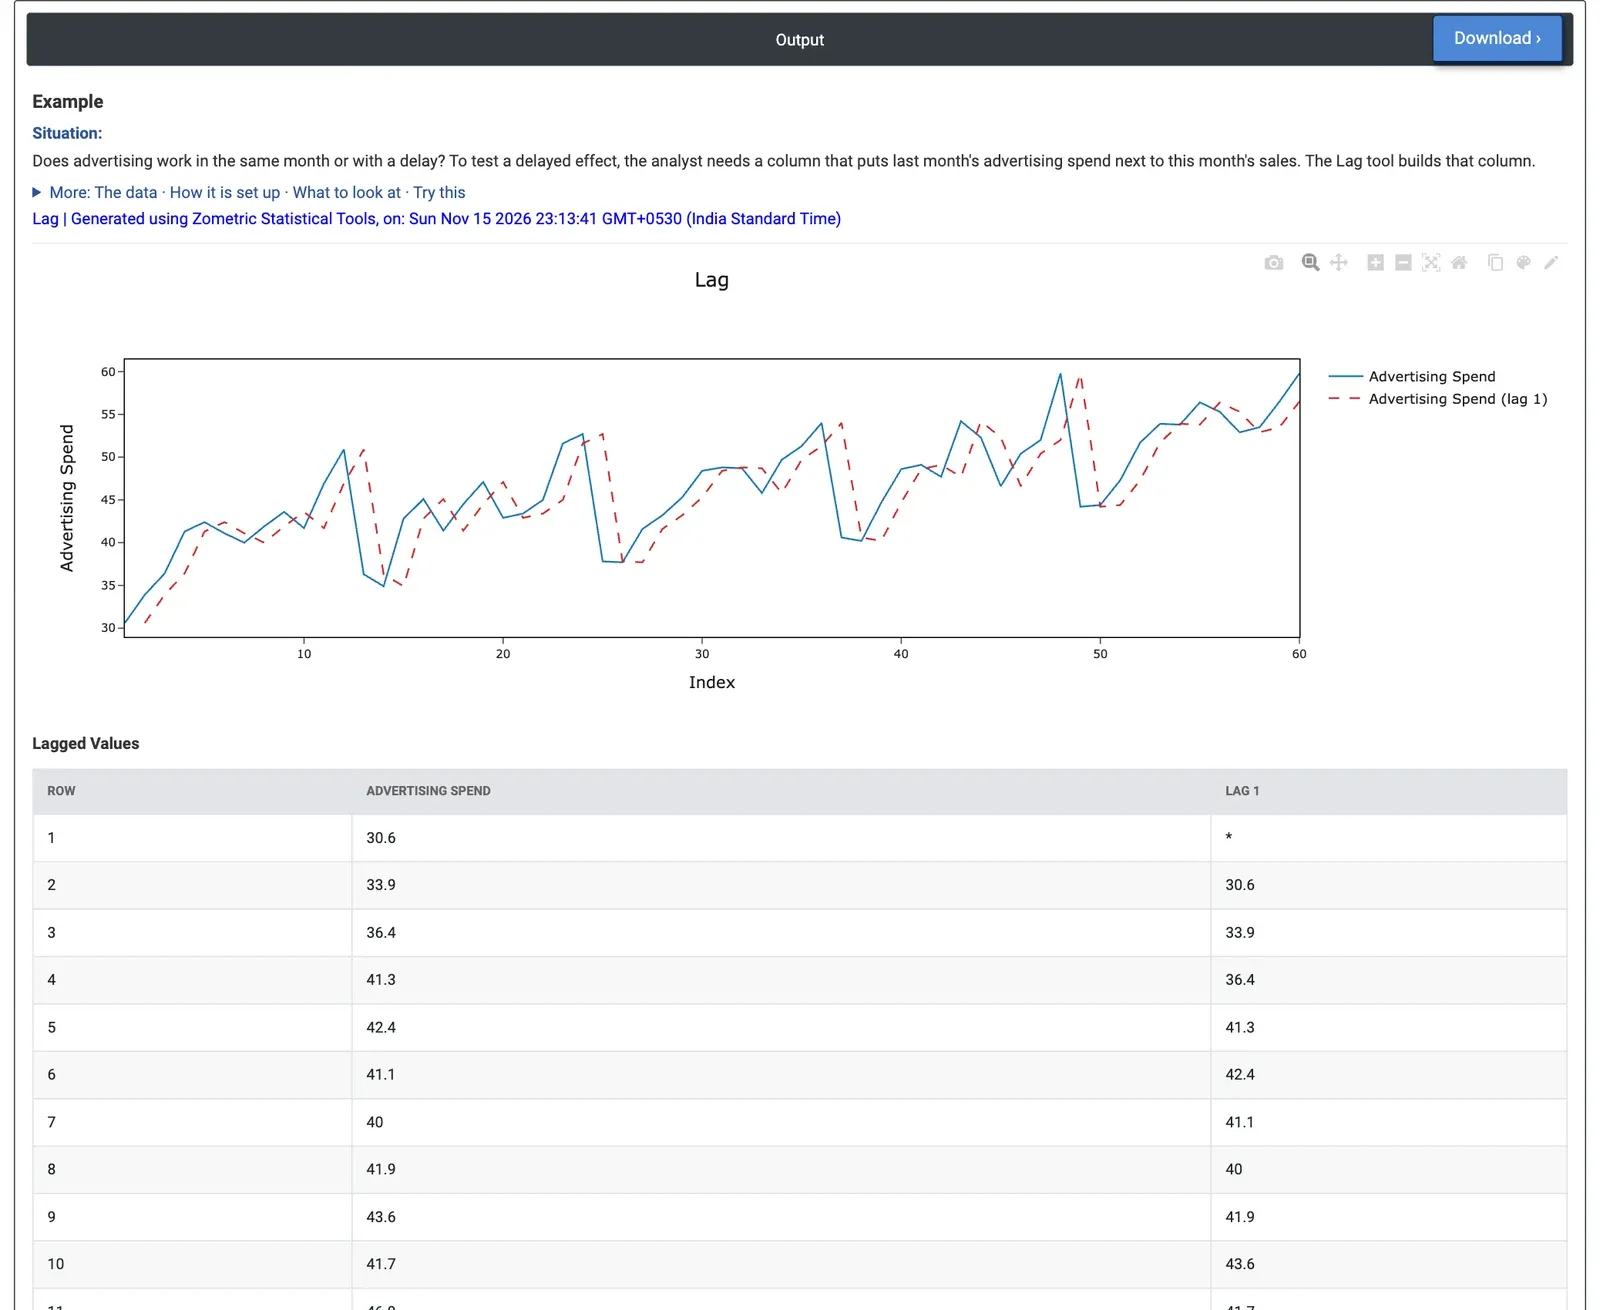
Figure 2 — Monthly advertising spend and the same series shifted by one month; row 2 shows January's 30.6.
Worked Example
A consumer electronics distributor records unit sales and advertising spend (thousand dollars) every month from January 2020 to December 2024. The marketing manager asks whether advertising works in the same month or with a delay. To test a delayed effect, the analyst needs last month's spend next to this month's sales. The analyst selects Variable = Advertising Spend and Lag = 1.
Row 1 shows * because there is no December 2019; row 2 (February 2020) shows January's 30.6, row 3 shows February's 33.9, and so on. On the plot the dashed lagged line runs one month behind the solid line, and the yearly drop in spend from December to January (13.4 to 15.6 thousand dollars each year) appears one month later in the lagged column.
Correlating the 59 complete rows with Sales gives 0.81 for last month's spend, against 0.93 for spend in the same month. Most of the link is within the month; a delayed effect, if any, is weaker, which matches the Cross Correlation Function of the two series. For the decision, a sales model should start with same-month spend; the lagged column can then be tried as an extra term to see whether it adds anything. With Lag = 12 each month lines up with the same month a year earlier instead.