
Line Plot
On this page
Purpose
A Line Plot draws one or more numeric columns as lines, in row order or against a chosen X column, so you can follow how each one changes and compare them on the same axes. Use it for readings taken in sequence without proper timestamps (cut number, cycle, batch, sample number), for comparing several machines, tools or heads over the same sequence, or for profiles such as a temperature along a part.
Key Capabilities
- One Y column, or several columns overlaid with one colour each.
- X axis from a column, or the row order (1, 2, 3 …) if none is chosen.
- Color-category column to split one Y column into separate lines by group.
- Markers at each point, and an optional filled area under each line.
- Data Options to exclude rows, or keep only rows, by row number or by a condition.
- Interactive graph: hover for values, click a legend entry to hide or show a line, zoom and download as an image.
Statistical Methods
No statistics are calculated: the plot joins the values in the order of the X axis. Each Y column is converted to numbers, and rows with a missing or non-numeric value are left out of that line. When several Y columns are chosen, each column becomes its own line and the Y axis title lists the column names. When one Y column and a Color-category column are chosen, the rows of each category form their own line. Without an X-axis column, the remaining rows are numbered 1, 2, 3 … in worksheet order, after any rows removed by Data Options.
Reading the plot: a line plot shows level, trend and noise together. Judge a trend over many points rather than from the last reading, because point-to-point noise can change the order of the lines at any single point. To put a number on a trend, fit it with Trend Analysis or a regression; to judge whether the variation is normal for the process, use a control chart.
Input Fields & Options
Field | Description |
Y variable(s) | Required. One or more numeric columns; several are overlaid (Multiple Y's mode). Hold Ctrl or Command to select several. |
X-axis column | Optional. Row order is used if left blank. |
Color-category column | Optional. Splits the data into one line per category; select -- for none. |
Show markers | Ticked by default: a marker at each point. |
Fill area under line | Unticked by default. Shades the area between each line and zero (Data Display: Area). |
Title | Title shown on the graph. Default Line Plot. |
Discrete color sequence | Palette for the series, default D3. |
Data Options: Subset (optional) | Exclude matching rows (default) or Include only matching rows, matched by Row numbers (e.g. 3,7,12-15, using the original grid row numbers) and/or a Condition (e.g. Cut_Number <= 20). Has no effect unless Row numbers or Condition is filled in. |
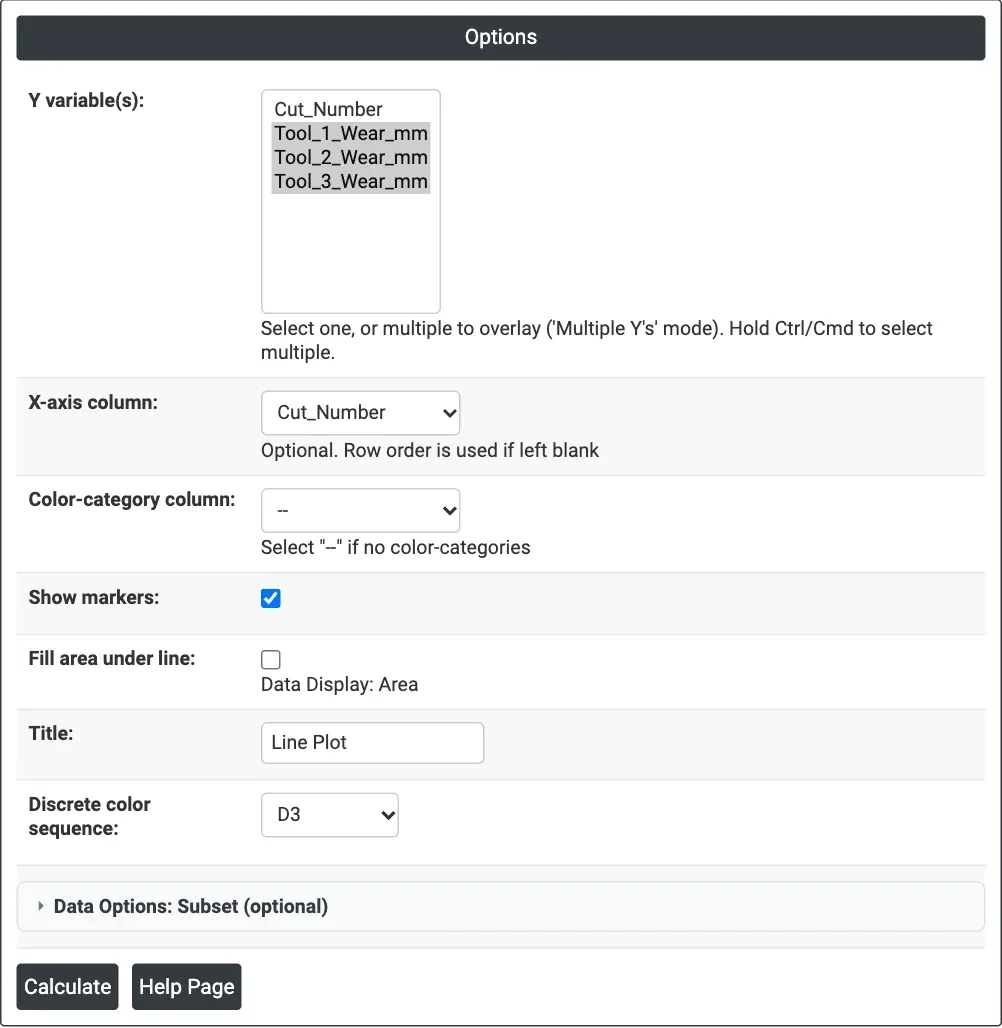
Figure 1 — Wear of three cutting tools plotted against Cut_Number, with markers.
Output Descriptions
- Line Plot — one line per Y column (or per category), with a legend.
- PDF export via Download.
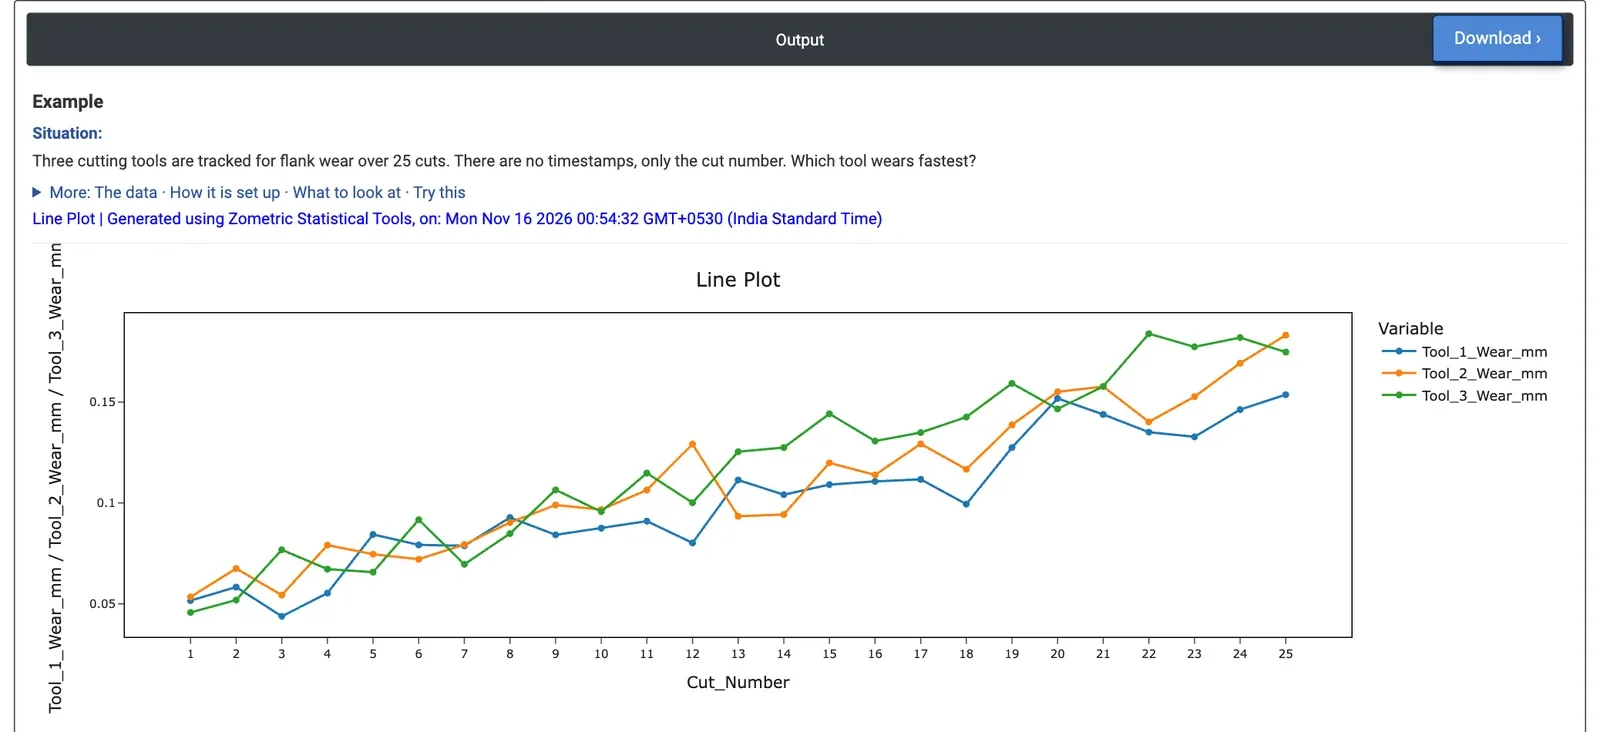
Figure 2 — Flank wear of three tools over 25 cuts: all rise steadily, Tool 3 mostly on top.
Worked Example
A machining cell tracks the flank wear of three cutting tools over 25 cuts. There are no timestamps, only the cut number. The process engineer wants to know which tool wears fastest. The engineer selects Tool_1_Wear_mm, Tool_2_Wear_mm and Tool_3_Wear_mm as Y variable(s), Cut_Number as X-axis column, and keeps Show markers ticked.
All three tools wear steadily, from about 0.05 mm at cut 1 to between 0.15 and 0.18 mm at cut 25, with visible cut-to-cut noise. Tool 3 is the highest line in 11 of the 12 cuts from 13 to 24 and reaches the highest reading of all, 0.184 mm at cut 22. Straight lines fitted to the data give wear rates of 0.0041 mm per cut for Tool 1, 0.0047 for Tool 2 and 0.0056 for Tool 3: Tool 3 wears about a third faster than Tool 1.
Because of the noise, Tool 2 ends highest at cut 25 (0.183 mm against 0.175 for Tool 3), so judging by the last reading alone would pick the wrong tool. For the decision this means checking Tool 3's insert grade or setting first, and planning tool changes on the wear rate. Ticking Fill area under line shades the area under each line, which can make one tool easier to follow but hides the lines behind it.