
Moving Range Chart (MR Chart)
On this page
Purpose
The Moving Range Chart (MR chart) monitors the short-term variation of a process measured one value at a time. Each point is the range between consecutive readings, so the chart shows whether the jump from one unit to the next stays within what the process normally does. A point above the upper control limit means a sudden change between two readings, for example an erratic valve, a tool change or a mix-up of material. Use it with the Individuals Chart, which watches the level; the I-MR chart shows both together.
Key Capabilities
- Moving ranges of length 2 (consecutive pairs) or longer, up to 100 points.
- σ from the average or median moving range or the square root of MSSD, or from a known process standard deviation.
- Nelson tests 1 to 4 with adjustable K; failing points are marked and listed in a table.
- Extra lines at multiples of the moving-range standard deviation (+2σ by default).
- Stages with separate limits, parameters estimated from chosen observations only, row subsets and an x-axis label column.
- Up to 10 columns at once, one chart each.
Statistical Methods
With the default length 2, each moving range is MRᵢ = |xᵢ − xᵢ₋₁|, starting at the second observation; with a longer Length moving range L, it is the range (maximum − minimum) of the L most recent values, starting at observation L. The process standard deviation σ is MR̄ / d₂ (Average moving range), median(MR) / d₄ (Median moving range) or the square root of MSSD, √[Σ(xᵢ₊₁ − xᵢ)² / (2(n − 1))], divided by c₄′ when Use unbiasing constant is ticked. A Process sd entered replaces the estimate.
The centre line is CL = d₂·σ, which equals MR̄ for the average moving range method. The standard deviation of a moving range is d₃·σ, so UCL = d₂σ + K·d₃σ and LCL = max(0, d₂σ − K·d₃σ), where K is the K for Rule 1 (default 3). For length 2, d₂ = 1.128 and d₃ = 0.853, which gives the familiar UCL = 3.267·MR̄ and LCL = 0. The additional lines are drawn at d₂σ ± m·d₃σ for the multiples m entered.
Only Nelson tests 1 to 4 are applied to the moving ranges: 1, a point more than K standard deviations from the centre line (in practice above the UCL); 2, K points in a row on the same side of the centre line; 3, K points in a row all increasing or all decreasing; 4, K points in a row alternating up and down. Consecutive moving ranges share a reading, so they are not independent; treat runs on this chart with caution and give most weight to points above the UCL.
Input Fields & Options
Field | Description |
Individual value column(s) | Required. One or more numeric columns (up to 10), each charted separately in row order; at least 5 values each. |
Process sd | Optional. A known process standard deviation replaces the estimated σ and so sets the centre line and limits. |
Sd estimation method | Average moving range (default), Median moving range or Square Root of MSSD. |
Use unbiasing constant | Ticked by default. Applies to the Square Root of MSSD method only. |
Batch/Lot | Optional text shown in a study information table. |
Show decimals | Decimals shown in the limit labels, 1 to 7 (default 3). |
Length moving range | Default 2; 2 to 100. Number of consecutive points in each moving range. |
Chart title / Chart y axis label | Optional. Default: the column name. |
Check Rule 1–4 / K for Rule 1–4 | On by default with K = 3, 9, 6 and 14. K for Rule 1 also sets the width of the control limits. Rules 5 to 8 are not offered: as in Minitab, only tests 1 to 4 apply to a moving range chart. |
Additional CLs at multiples of sd 1 / sd 2 | Extra lines at these multiples of the moving-range standard deviation. Default: empty and 2. |
Define stages (historical groups) with this variable | Optional column marking stages; limits are calculated per stage. |
X scale | Optional column used to label the horizontal axis (e.g. dates). |
Include or Exclude / Specify which rows | All rows by default, or include or exclude the row numbers given (e.g. 4 7 11:14). |
Specify subgroups to estimate parameters / Subgroups | Omit (default) or Use the listed observations (e.g. 3 12:15) when estimating σ; all moving ranges are still plotted. |
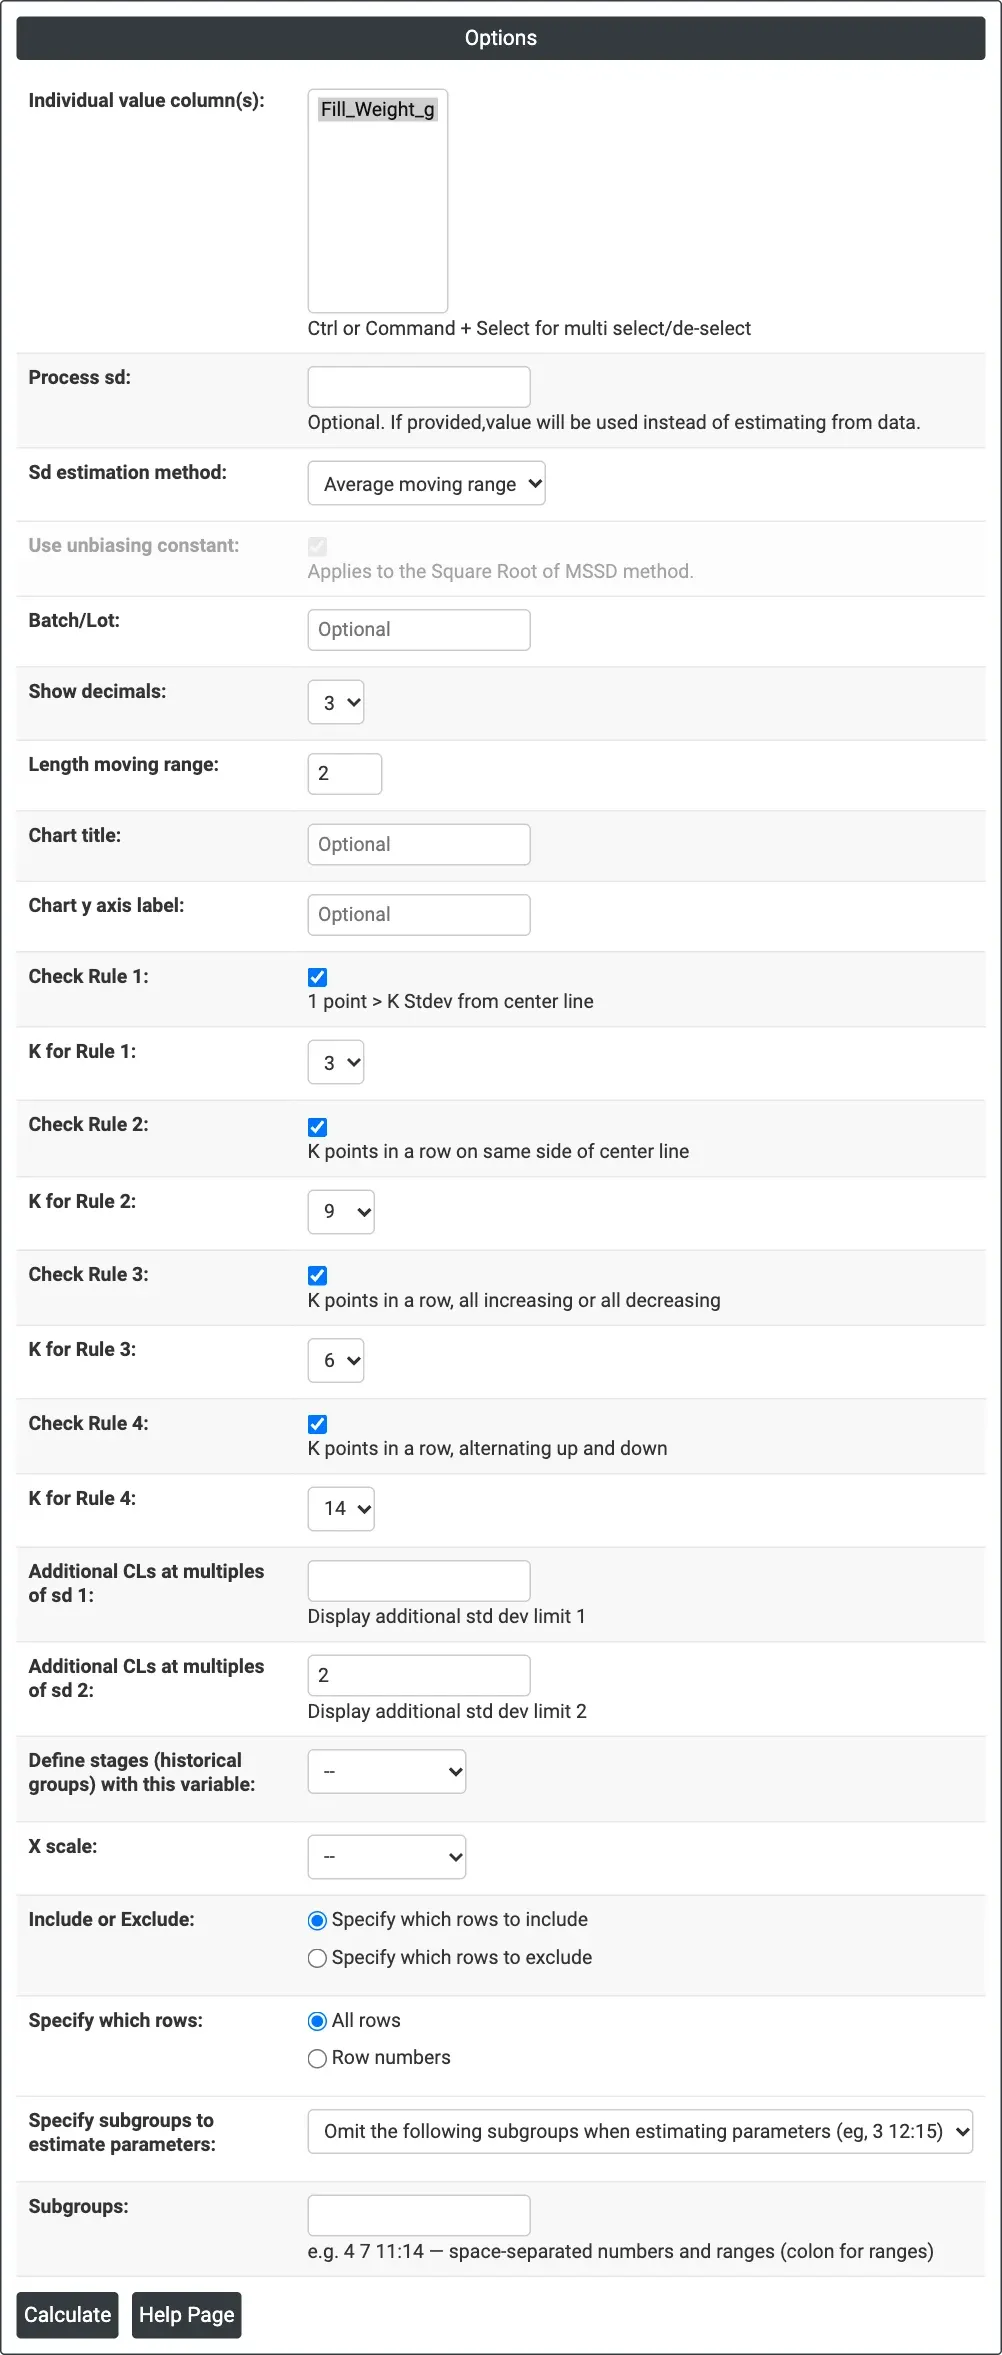
Figure 1 — Options for the example: Fill_Weight_g with the average moving range of length 2 and the default rule settings.
Output Descriptions
- MR Chart @ <column> — the moving ranges in order with the centre line (CL), UCL, LCL and the additional σ lines; failing points are marked in red with their rule numbers.
- Nelson's Rules table — each rule that failed and the observation numbers of the potential special-cause points.
- PDF export via Download.
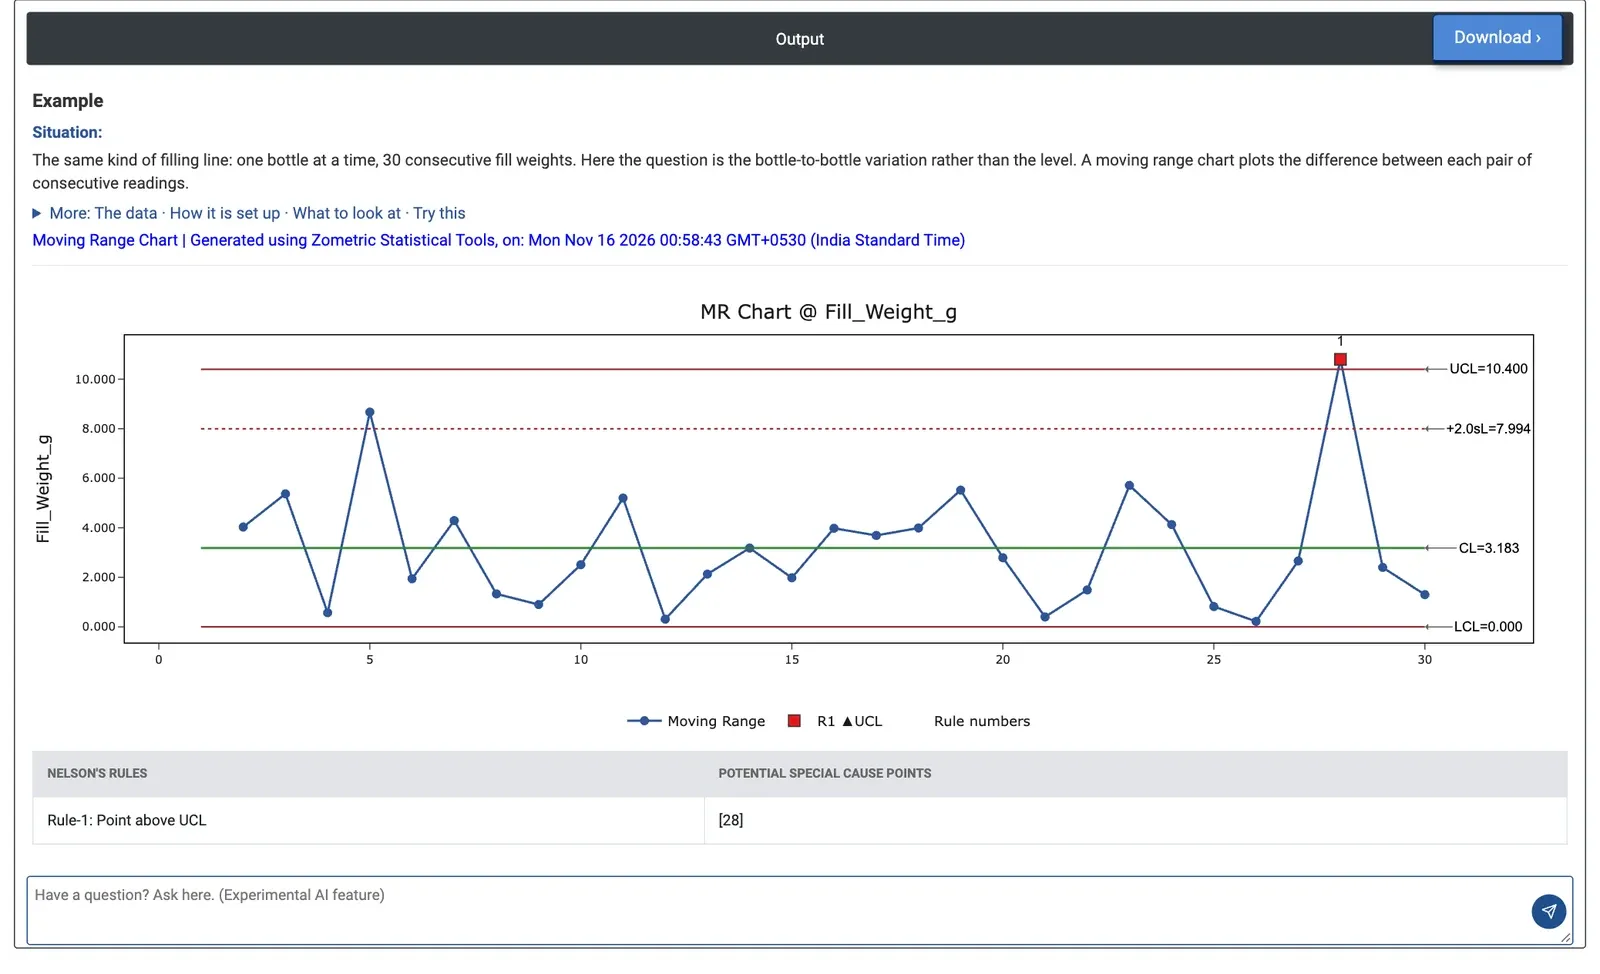
Figure 2 — MR chart of 30 consecutive bottle fill weights: the moving range at bottle 28 (10.8 g) is above the UCL of 10.400 g.
Worked Example
A filling line fills one bottle at a time. The line supervisor logs the fill weight of 30 consecutive bottles and wants to know whether the bottle-to-bottle variation is stable, separately from the average fill. Individual value column(s) = Fill_Weight_g, Sd estimation method = Average moving range, Length moving range = 2, default rules.
The 29 moving ranges average 3.183 g, which is the centre line; σ = 3.183 / 1.128 = 2.822 g. The UCL is 10.400 g, the +2σ line 7.994 g and the LCL 0. Only one point fails: the moving range at bottle 28 is 10.8 g (from 501.60 to 512.40 g), above the UCL (Rule 1). The largest of the other moving ranges is 8.67 g at bottle 5, and the last two (2.40 and 1.30 g) are back to normal.
So the filler did not become more erratic from bottle to bottle; it made one sudden step between bottles 27 and 28 and then stayed at the new, higher level. That pattern points to a single event, such as a setting change or a valve sticking, rather than general wear. The Individuals Chart on the same column confirms it: bottles 28 to 30 are above its UCL. The supervisor should find what changed just before bottle 28 and correct the fill level; the moving range limits need no change.