
Nonparametric Distribution Analysis (Arbitrary Censoring)
On this page
Purpose
Nonparametric Distribution Analysis (Arbitrary Censoring) estimates the survival curve of a product from inspection-type life data without assuming any distribution. The data can mix exact failures with units found failed between two inspections (interval-censored), units already failed at the first check (left-censored) and units still working when last seen (right-censored). Use it to read off the fraction surviving at each inspection age and the median life straight from the data, or to check a parametric fit.
Key Capabilities
- Data entered as a Start column and an End column; the pattern of blank and filled cells sets the type of censoring on each row.
- Turnbull estimate of the survival curve, the generalisation of Kaplan-Meier to interval- and left-censored data, as Minitab computes it.
- Probability of failure in each interval where the estimate places failures, with the survival probability at its end.
- The interval that contains the median life.
- Survival plot of the Turnbull estimate.
Statistical Methods
Each row is read from its Start and End values: Start = End is an exact failure; Start < End is a failure somewhere after Start and up to End (interval-censored); End blank is right-censored at Start; Start blank is left-censored at End. When failures are only known to lie in intervals, the Kaplan-Meier method cannot be used directly. The Turnbull method finds the distribution that makes the observed intervals most likely (the nonparametric maximum likelihood estimate). Probability can only sit in Turnbull's innermost intervals: the gaps between a left end and the next right end when all the Start and End values are sorted. The tool starts with equal probabilities on these intervals and repeats the self-consistency (EM) step, sharing each unit out over the innermost intervals inside its own interval in proportion to the current probabilities and averaging over the units, until the probabilities stop changing.
The table lists, for each innermost interval that receives probability, its Lower and Upper limits (* for an open end), the Probability of Failure in that interval and the Survival Probability at its end, one minus the running total. The estimate says how much probability lies in each interval but not where inside it, so the median is reported as the interval in which the survival probability falls to 0.5 or below, and no mean is given, as in Minitab. The survival plot draws each drop at the end of its interval.
No confidence bounds are given: the Turnbull estimate has no simple variance formula of the Greenwood type, and the tool says so in a note. For confidence bounds on survival or percentiles, fit a distribution with Parametric Distribution Analysis (Arbitrary Censoring).
Input Fields & Options
Field | Description |
Start column | Required. Last known good time, or the exact failure time. Leave Start blank on a row to mark it left-censored. |
End column | Required. First known failed time, or the exact failure time. Leave End blank on a row to mark it right-censored. Start = End means an exact failure; Start < End means interval-censored. Must differ from the Start column. |
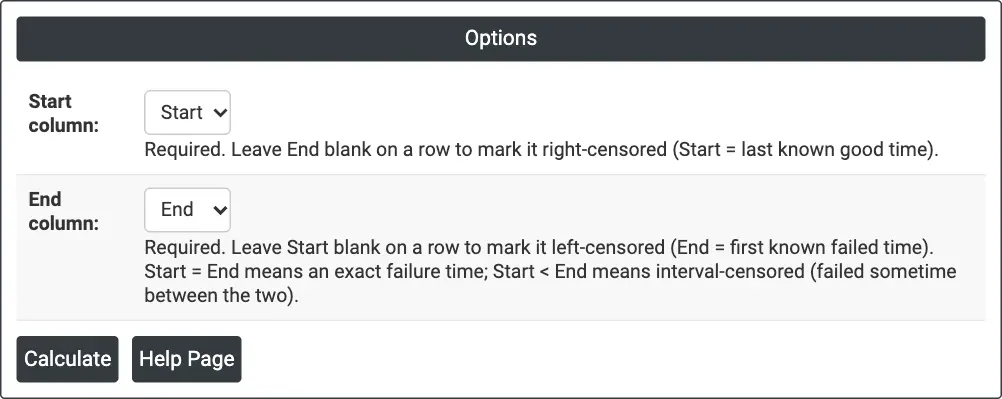
Figure 1 — Options for the example: inspection data in a Start column and an End column.
Output Descriptions
- Censoring table — the number of uncensored, left-censored, interval-censored and right-censored values.
- Characteristics — the Median, given as the interval that contains it (for example between 50 and 60).
- Notes — that the estimate gives the probability of failure in each interval but not where inside it, that confidence bounds are not available, and when the median is not estimable.
- Turnbull table — Lower, Upper, Probability of Failure and Survival Probability for each interval.
- Turnbull Survival Plot — the survival estimate against time, starting at 1 at time 0.
- PDF export via Download.
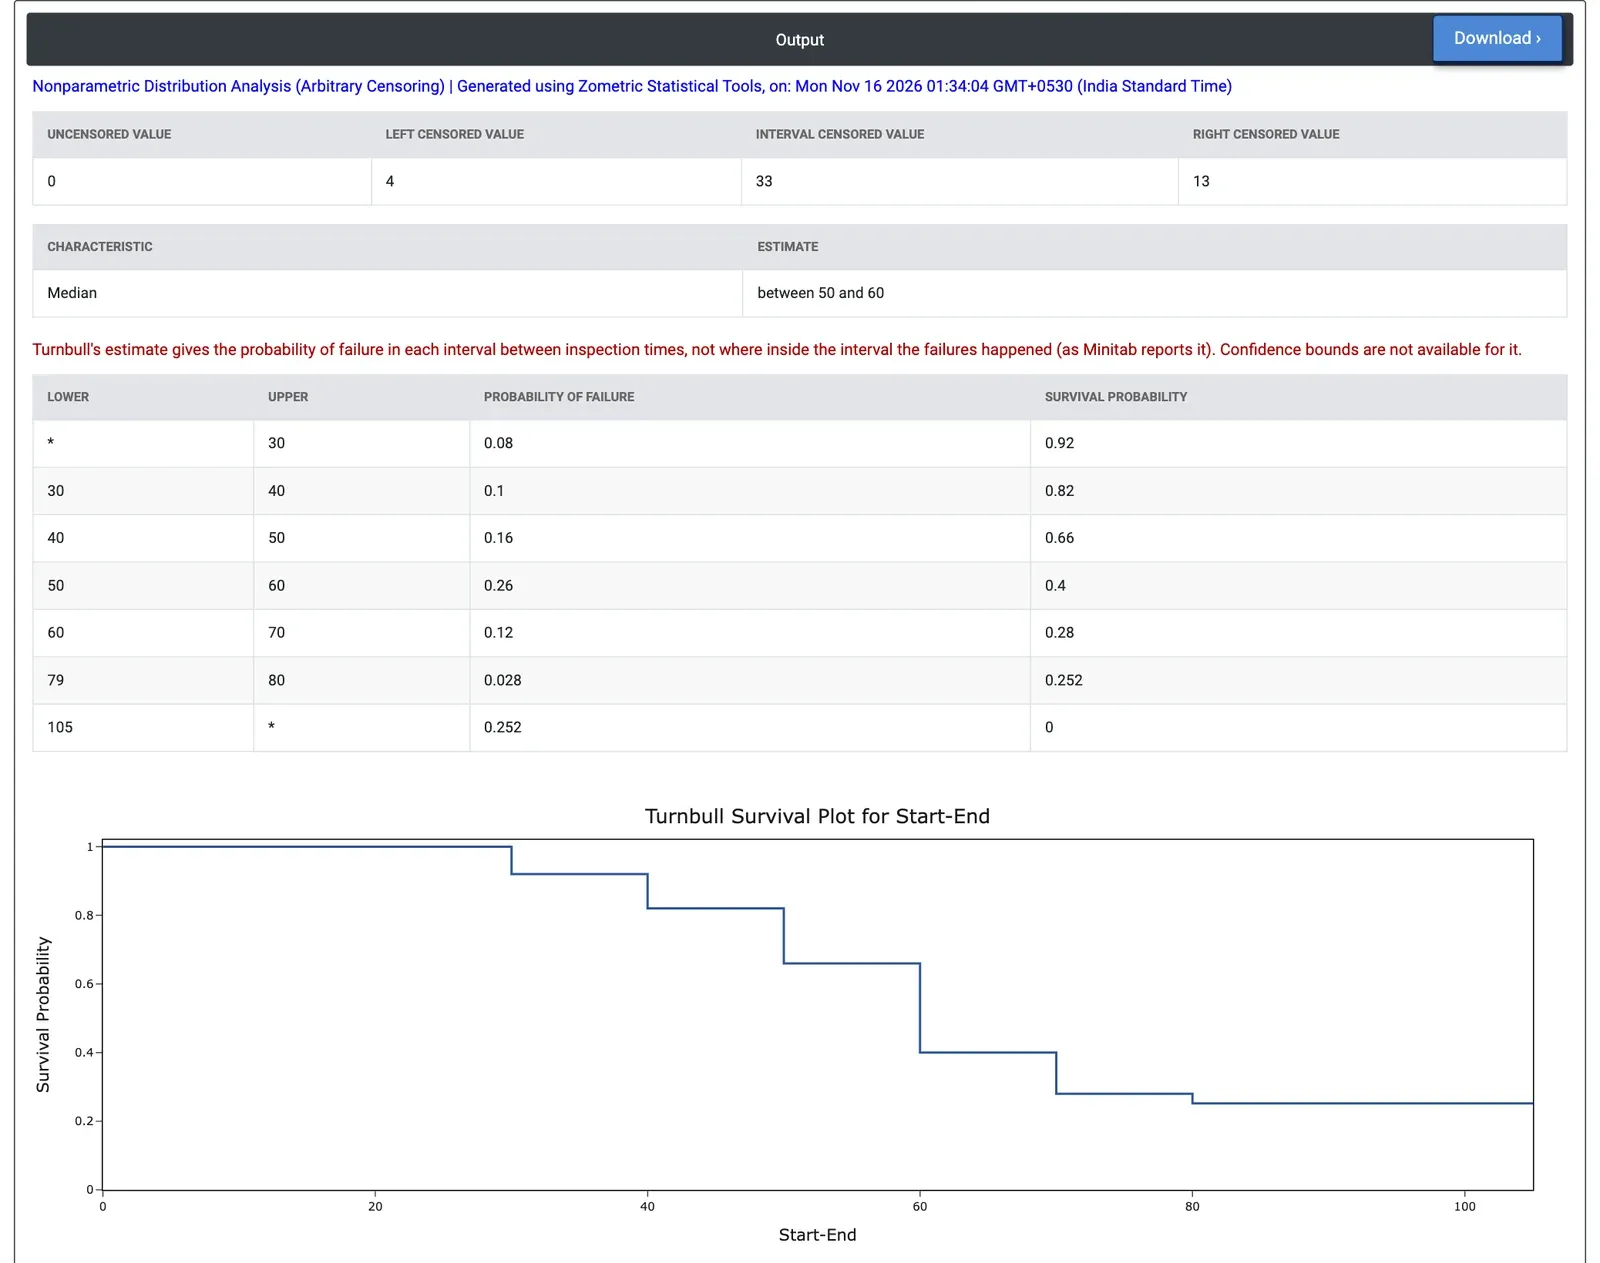
Figure 2 — Turnbull estimate for 50 windings checked every 10 hours: probabilities of failure 0.08, 0.10, 0.16, 0.26 and 0.12 in the inspection intervals up to 70 hours, survival 0.252 after 80 hours, median between 50 and 60 hours.
Worked Example
Turbine engine windings are tested at 80 °C but checked only at inspections every 10 hours from 30 hours. This example uses the 50 windings of the right-censoring examples recorded that way: 4 are found failed at the first inspection (left-censored, End = 30), 33 are found failed at a later inspection (interval-censored, for example Start = 50, End = 60), and 13 are removed before failure (right-censored, End blank). The engineer wants the fraction surviving to each inspection age without assuming a distribution, and selects Start and End as the Start and End columns.
The probability of failure is 0.08 before 30 hours, 0.10 between 30 and 40 hours, 0.16 between 40 and 50, 0.26 between 50 and 60 and 0.12 between 60 and 70, so the estimated survival is 0.92 at 30 hours, 0.82 at 40, 0.66 at 50, 0.40 at 60 and 0.28 at 70 hours. The largest group, 13 windings, fails between 50 and 60 hours. The single failure found between 70 and 80 hours can only have happened after the windings removed at 73, 77 and 79 hours, so the estimate puts it between 79 and 80 hours with probability 0.028, leaving survival 0.252 after 80 hours. The last row, 105 to *, holds the remaining 0.252: these windings were all removed before failure, so the data say only that they would fail after 105 hours. The median lies between 50 and 60 hours, the interval in which the survival falls below 0.5.
These figures are close to the Kaplan-Meier estimate from the exact failure times (survival 0.66 at 50 hours and 0.40 at 60 hours, median 55 hours), so inspecting every 10 hours loses little information, apart from where inside each interval the failures happened. For a model-based estimate with confidence bounds, a single median or percentiles between inspection times, the next step is Parametric Distribution Analysis (Arbitrary Censoring).