
Nonparametric Growth Curve
On this page
Purpose
Nonparametric Growth Curve analyses repairable systems: machines, vehicles or units that are repaired and returned to service after each failure, so that one system can fail many times. It estimates the mean cumulative function (MCF), the average number of failures per system up to each age, without assuming any model for how the failure rate changes. Use it to see whether repairs are becoming more or less frequent as systems age, to compare the repair rate with a target, and to plan spares and maintenance.
Key Capabilities
- Works with recurrent failure data: one row per failure, with the age at failure and the system it happened on.
- Nelson's MCF estimate at every failure age, with its standard error and confidence interval.
- Number of systems still under observation at each age, so you can see where the estimate rests on few systems.
- Event plot of each system's failures along the age axis.
- MCF plot with confidence bands.
Statistical Methods
Each system's failures are sorted by age, and the age of its last recorded failure is taken as the end of its observation: there is no separate censoring column. At each distinct failure age tⱼ, dⱼ is the total number of failures across all systems at that age and rⱼ the number of systems still under observation (those whose last recorded age is at least tⱼ). Nelson's estimate of the mean cumulative function is M(tⱼ) = Σ dₖ / rₖ over all ages up to tⱼ. Systems whose records have ended no longer count in rⱼ, so the estimate allows for systems observed for different lengths of time.
The variance of M(t) is estimated with Nelson's formula, which uses each system's own failure counts at every age: Var(M(tⱼ)) = Σₖ Σᵢ (dNᵢₖ − Yᵢₖ · dₖ / rₖ)² / rₖ², where dNᵢₖ is system i's failure count at age tₖ and Yᵢₖ is 1 if system i is still observed then. The confidence interval is M ± z·SE, with the lower limit cut at 0, where z is the standard normal value for the confidence level.
The slope of the MCF is the repair rate. A straight MCF means a constant rate of repairs; a curve that bends upwards means repairs are becoming more frequent with age (the systems are wearing out); a curve that flattens means they are becoming less frequent (reliability growth). Near the end of the age range only a few systems remain under observation, so the estimate there is less certain and the band widens.
Input Fields & Options
Field | Description |
Variable/Failure age | Required. Age of the system at each failure, one row per failure. |
System ID | The column identifying which system each failure happened on. |
Confidence level (%) | For the MCF confidence interval. Default 95; 50 to 99.99. |
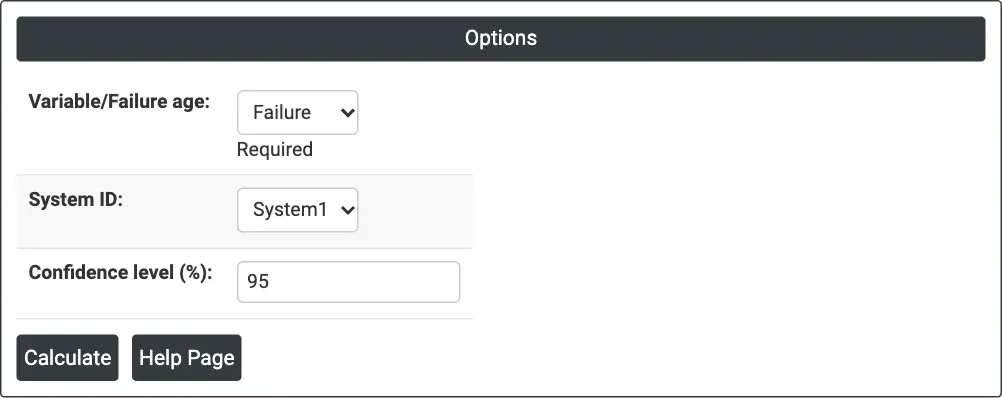
Figure 1 — Options for the example: failure ages of air-conditioning units in the Failure column, plane number in System1.
Output Descriptions
- Method table — System column, Model (Nonparametric (Nelson MCF)), N Systems and N Events.
- MCF table — for each failure age: Age, Number at Risk, Number of Events, MCF, Standard Error and the confidence limits.
- Event Plot — one row per system, in order of the system ID, with each failure marked as a star on a line that runs from age 0 to the system's last recorded age.
- Nonparametric Growth Curve (MCF) — the mean cumulative number of events against age, with the confidence band.
- PDF export via Download.
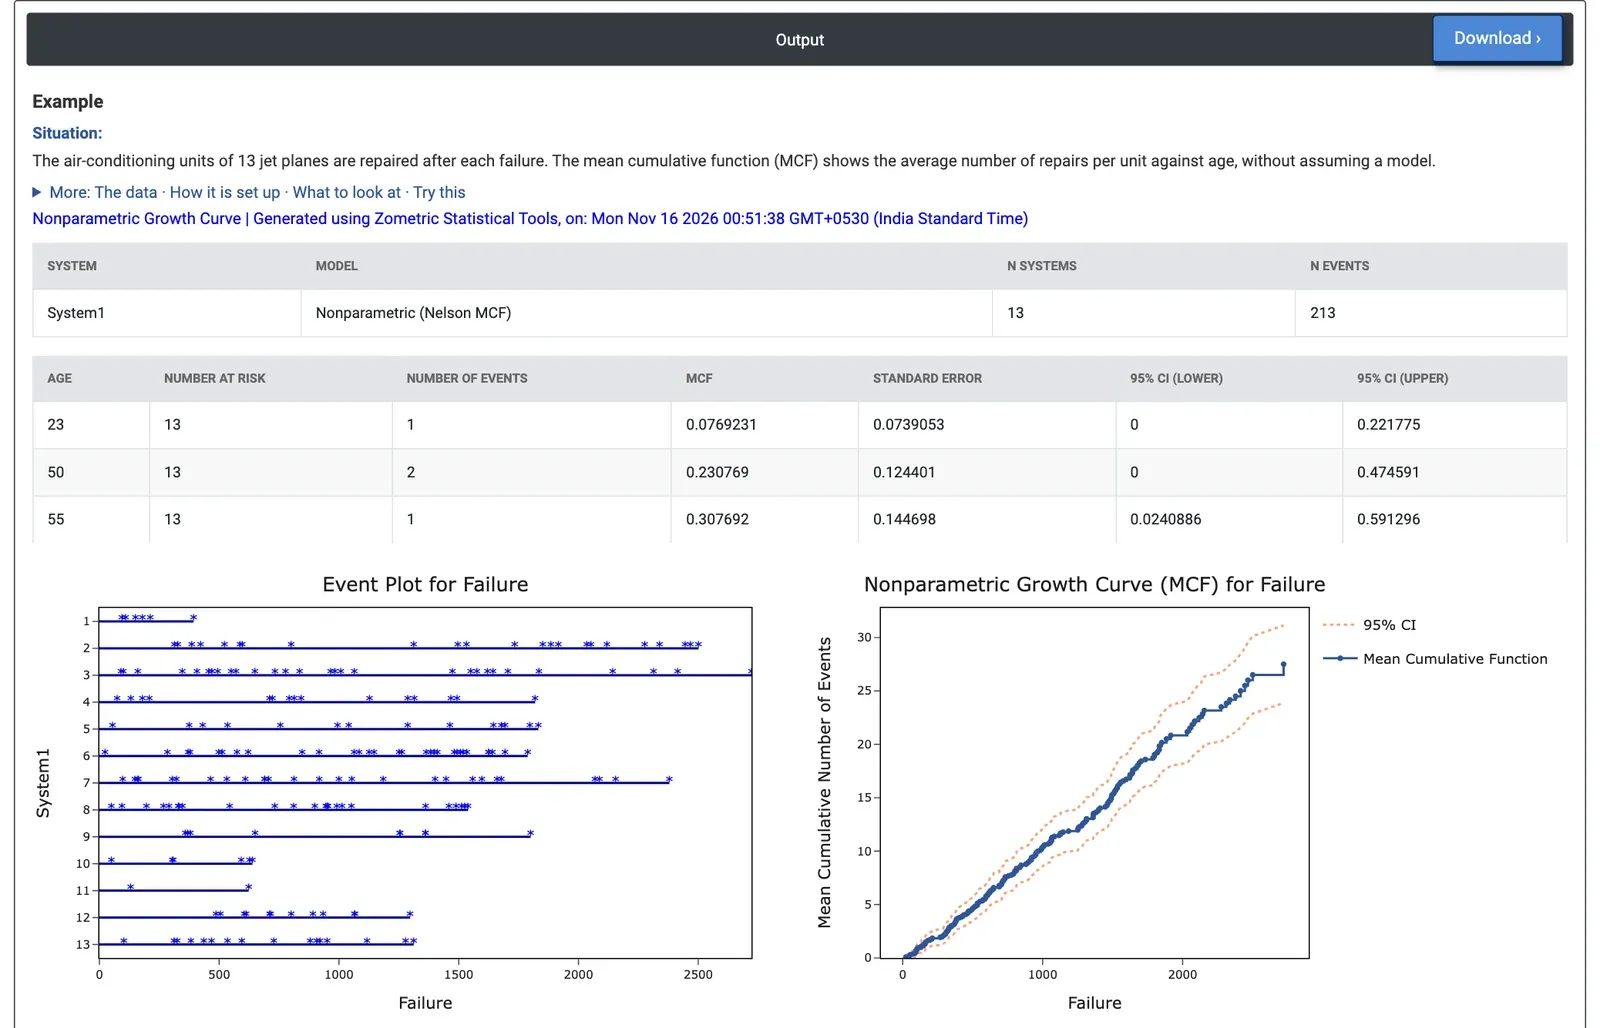
Figure 2 — Method table, the start of the MCF table, the Event Plot and the MCF plot for 213 repairs on 13 planes: each plane's repairs are marked along its own line, and the MCF is a nearly straight line of about one repair per unit per 100 hours.
Worked Example
A reliability engineer studies the air-conditioning units of 13 commercial jet planes. Each unit is repaired after a failure and returned to service, and the data hold 213 failures with the unit's age in hours at each one. The engineer wants to know whether the repair rate changes as the units age. They set Variable/Failure age = Failure and System ID = System1, and keep 95% confidence.
The MCF reaches 4.61 repairs per unit by 498 hours (95% CI 3.49 to 5.73), 10.37 by 1,000 hours (8.60 to 12.15), 15.27 by 1,496 hours and 20.83 by 1,916 hours. That is about one repair per unit every 100 hours throughout, and the MCF plot is close to a straight line: the repair rate does not change much with age, so there is no sign of wear-out or of improvement.
The Number at Risk column shows how much data supports each part of the curve. It falls from 13 to 12 at 407 hours, after the first plane's record ends at 393 hours, is 10 at 1,000 hours and only 3 at 1,916 hours, and at the last failure age (2,722 hours) a single plane remains. The end of the curve is therefore uncertain, which the widening band shows. For planning, the near-constant slope supports budgeting spares and maintenance at about one repair per unit per 100 operating hours.