
1-Sample Equivalence Test
On this page
Purpose
The 1-Sample Equivalence Test shows whether the mean of a sample is close enough to a target, within limits you set in advance. A 1-sample t-test can only say whether the mean differs from the target; a non-significant t-test does not prove that it is on target. The equivalence test turns the question round: the null hypothesis is that the mean is outside the limits, so a significant result is positive evidence that the difference is too small to matter. Use it for questions such as whether a batch's mean potency is within ±5% of the label claim, or whether a process mean is within an agreed band around nominal.
Key Capabilities
- Two one-sided tests (TOST) for Lower limit < test mean − target < upper limit, with the confidence interval for equivalence.
- One-sided alternatives: difference above the lower limit, difference below the upper limit, or test mean above or below the target.
- Limits in the units of the data, or as fractions of the target (Multiply by target).
- Choice between the interval that includes the midpoint of the limits and the plain 100(1 − 2α)% interval.
- Plain-language conclusion under the interval and test tables.
- Equivalence plot, histogram, boxplot (with an outlier list) and individual value plot.
Statistical Methods
From the n values the tool computes the mean x̄, the standard deviation s and the standard error SE = s / √n. The difference is D = x̄ − target. For the default alternative, two one-sided t-tests are run with n − 1 degrees of freedom: t₁ = (D − lower limit) / SE tests the null hypothesis D ≤ lower limit (p-value from the upper tail), and t₂ = (D − upper limit) / SE tests D ≥ upper limit (p-value from the lower tail). Equivalence is claimed when both p-values are below α, which is the same as the greater of the two being below α.
The confidence interval for equivalence starts from D ± t(1 − α; n − 1)·SE and is stretched, if needed, to include the midpoint of the two limits (zero for symmetric limits); its level is 100(1 − α)%, as in Minitab. Equivalence is claimed when this interval lies inside the equivalence interval. With Use 100(1 − 2α)% CI ticked, the plain interval D ± t(1 − α; n − 1)·SE is shown instead, labelled as a 100(1 − 2α)% interval. The one-sided alternatives use one t-test and a one-sided confidence bound: test mean − target > lower limit, test mean − target < upper limit, or, for Test mean > target and Test mean < target, a bound of zero (a superiority or inferiority test). With Multiply by target, the limits entered are multiplied by the target, so 0.05 means 5% of the target.
The test assumes independent values from a roughly normal population; with 20 or more values, moderate skewness has little effect. Choose the limits from engineering or regulatory needs before looking at the data. Equivalence is about the mean: it does not say that every unit is inside the limits.
Input Fields & Options
Field | Description |
Sample | Required. Numeric column with the measurements; blank cells are ignored. |
Target | The value the sample mean is compared against, e.g. a nominal or label claim. Default 0. |
Alpha | Significance level, default 0.05. |
Alternative hypothesis | Lower limit < test mean − target < upper limit (default, equivalence), test mean − target > lower limit, test mean − target < upper limit, Test mean > target, or Test mean < target. |
Lower Limit / Upper Limit | Required. The equivalence limits for test mean − target; the lower limit must be below the upper limit. |
Boxplot of Sample / Histogram of Sample / Equivalence plot / Individual value plot | Graphs to draw. Only Equivalence plot is ticked by default. The boxplot also adds a list of outliers beyond 1.5 × IQR. |
Multiply by target | Off by default. The limits are fractions of the target, e.g. −0.05 and 0.05 for ±5%. |
Use 100(1 − 2α)% CI | Off by default. Shows the plain 100(1 − 2α)% interval instead of the one that includes the midpoint of the limits. |
Data Options: Subset (optional) | Exclude matching rows (default) or Include only matching rows, by row numbers (e.g. 3,7,12-15) and/or a condition. |
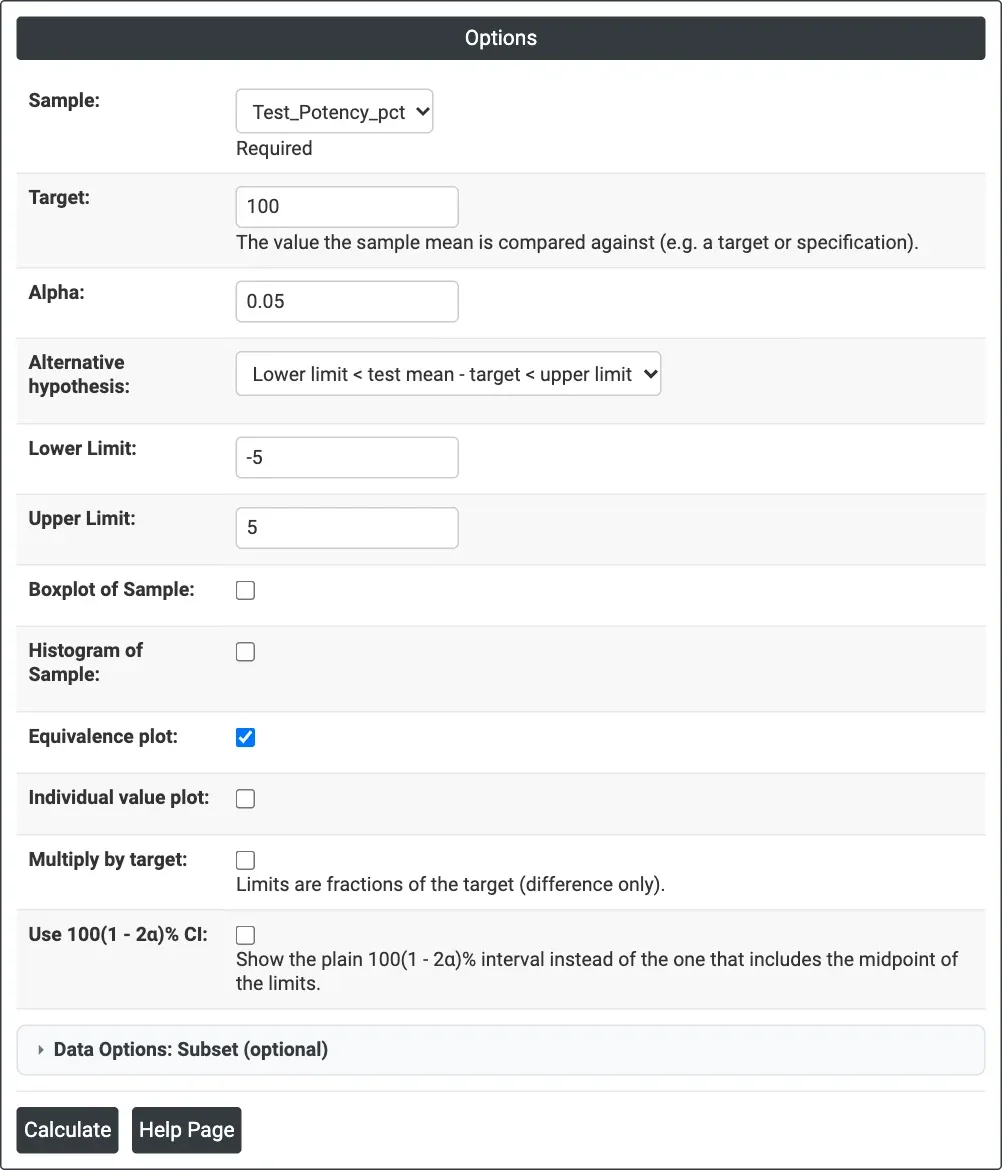
Figure 1 — Options for the example: Test_Potency_pct against a target of 100 with equivalence limits −5 and 5.
Output Descriptions
- Method — the difference tested: Sample mean − Reference value (target).
- Descriptive statistics — N, Mean, StDev and SE Mean.
- Difference table — Difference, StDev, SE, the 95% CI for Equivalence and the Equivalence Interval, with a note saying whether the CI is within the equivalence interval.
- Hypotheses — the null and alternative hypotheses and the significance level.
- Test table — DF, T-Value and P-Value for each one-sided test, with a note giving the greater p-value and whether equivalence can be claimed.
- Equivalence Test: Mean − <target> — the confidence interval against the lower (LEL) and upper (UEL) equivalence limits.
- Histogram of Sample, Boxplot of Sample and Individual Value Plot of Sample, when ticked.
- PDF export via Download.
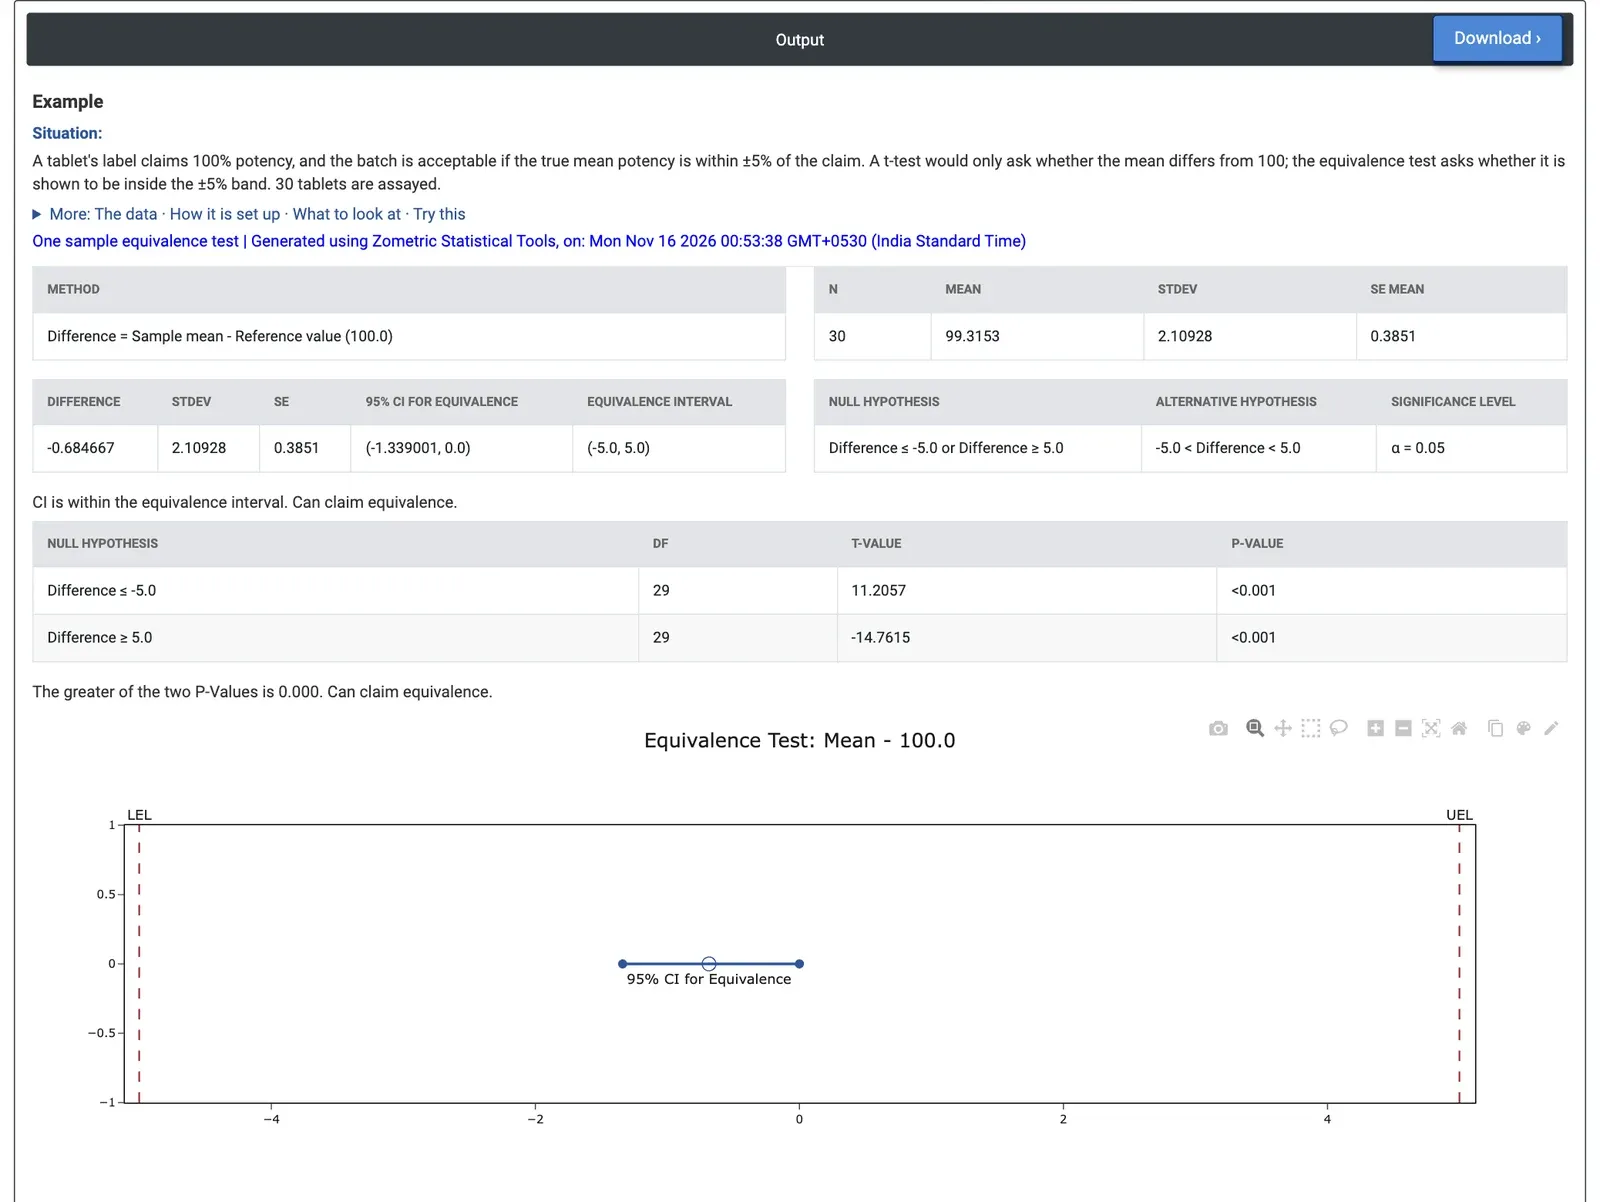
Figure 2 — The 95% CI for equivalence, −1.339 to 0, lies well inside the limits −5 to 5, and both one-sided tests give p < 0.001.
Worked Example
A tablet's label claims 100% potency, and a batch is acceptable if the true mean potency is within ±5% of the claim. The quality laboratory assays 30 tablets. Sample = Test_Potency_pct, Target = 100, Alpha = 0.05, the default equivalence alternative, Lower Limit = −5 and Upper Limit = 5.
The mean potency is 99.3153% with a standard deviation of 2.109 and a standard error of 0.3851; the tablets range from 95.19 to 103.86%. The difference from the target is −0.6847. The test against the lower limit gives t = 11.21 and the test against the upper limit t = −14.76, both with 29 degrees of freedom and p < 0.001. The 95% CI for equivalence is −1.339 to 0 (stretched to include 0), well inside −5 to 5, so the page reports that equivalence can be claimed: the batch mean is shown to be within ±5% of the label claim.
The width of the limits matters. With tighter limits of −1 and 1, the test against the lower limit gives t = 0.82 and p = 0.21, so equivalence cannot be claimed, even though the mean is only 0.68 below the target: with this sample size and spread, the data cannot rule out a mean 1% low. If only low potency is a concern, the alternative test mean − target > lower limit with a lower limit of −5 gives a single test with p < 0.001 and a 95% lower bound of −1.339.